Figure 6.
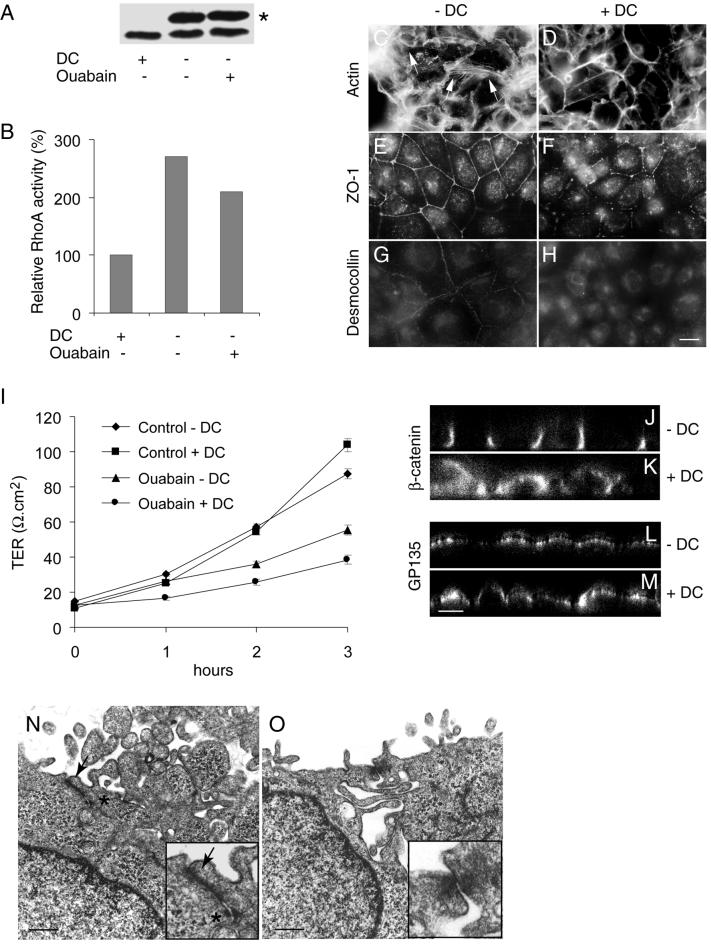
Formation of tight junctions, desmosomes and the induction of polarity in ouabain-treated MDCK-RhoAwt cells overexpressing RhoA. −DC and +DC represent ouabain-treated induced and noninduced MDCK-RhoAwt cells, respectively. (A) RhoA immunoblot showing induced high molecular mass Myc-tagged (∗) and endogenous RhoA after the withdrawal of DC. (B) Relative levels of active RhoA GTPase. The results shown are the representative data obtained from two independent experiments. (C and D) FITC-phalloidin staining of filamentous actin. Note the presence of bundled stress fibers in C and their absence in D. (E and F) Immunofluorescence of ZO-1. Ouabain-treated induced cells show a complete ring-like staining compared with the incomplete ZO-1 ring in noninduced cells. (G and H) Immunofluorescence of desmocollin. In ouabain-treated induced cells desmocollin is localized to the plasma membrane compared with the intracellular staining in noninduced cells (I). Measurement of TER (J–M). Confocal microscope X-Z sections. Note the polarized distribution of β-catenin and GP135 in ouabain-treated induced cells. (N and O) Transmission electron microscopy. Tight junctions (arrow) and desmosomes (asterisk) are present in ouabain-treated induced cells. Inserts are the higher magnification of the tight junction region in N and O. Bars in C–H, 10 μm; J–M, 5 μm; and N and O, 500 nm.

