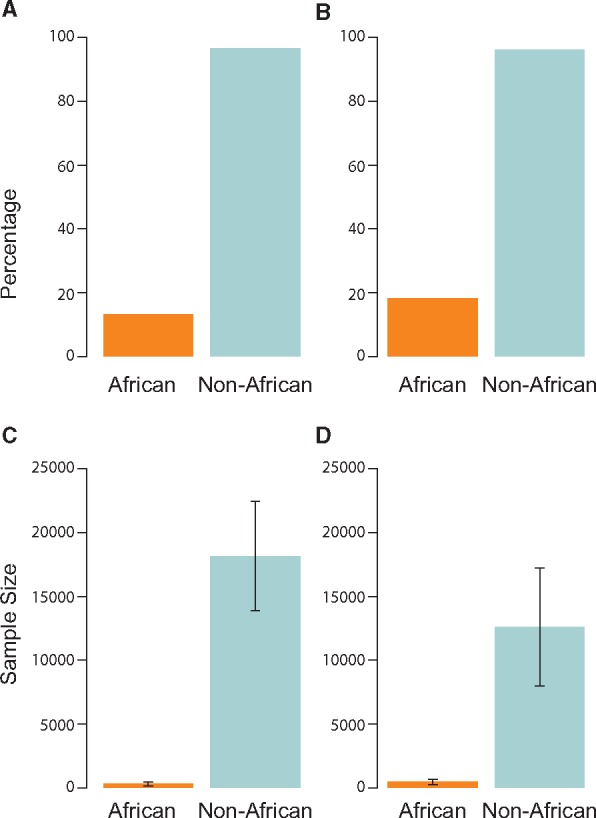
Figure 4.

Inclusion of African ancestry individuals in GWAS. (A) Percentage of studies including individuals with African ancestry versus non-African ancestry individuals in the discovery sample. (B) Percentage of studies including individuals with African ancestry versus non-African ancestry individuals in the replication sample. (C). Average sample size of individuals with African ancestry versus non-African ancestry individuals in the discovery sample. (D) Average sample size of individuals with African ancestry versus non-African ancestry individuals in the replication sample. Whiskers indicate 95% CIs. Data compiled from the NHGRI-EBI GWAS Catalog (https://www.ebi.ac.uk/gwas; date last accessed May 17, 2017) from 2015 to 2017.
