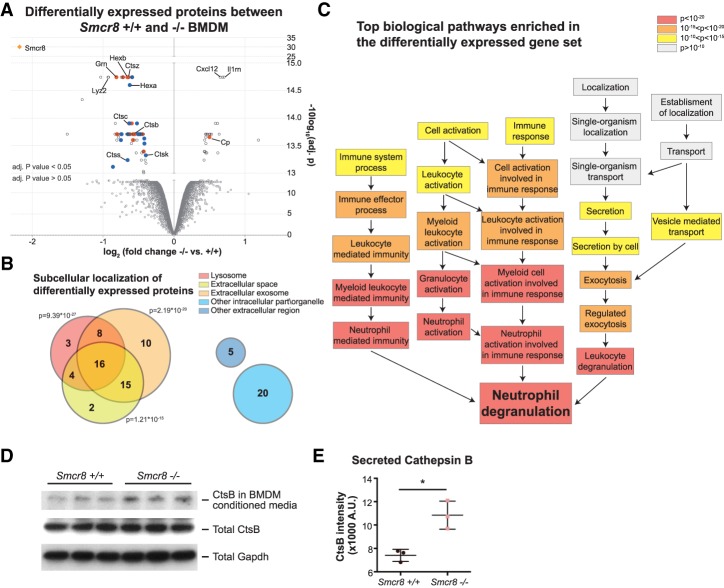
Figure 6.
Loss of Smcr8 results in down-regulation of lysosomal lumen protein expression. (A) Differentially expressed proteins in Smcr8−/− BMDMs compared with wild-type BMDMs by quantitative mass spectrometry. Data are represented as log2 of protein expression fold change in Smcr8−/− versus Smcr8+/+ on the X-axis and log10 of adjusted P-value by moderated t-test on the Y-axis. (Orange diamond) Smcr8; (blue dots) lysosome-located genes; (red dots) proteins that can be found in lysosomes, extracellular space, and extracellular exosomes. (B) Summary of gene ontology cellular component enrichment analysis of differentially expressed proteins in Smcr8−/− BMDMs. (C) Top biological processes that are enriched in the list of differentially expressed proteins in Smcr8−/− BMDMs. (D) Secreted cathepsin B (CtsB) in conditioned medium, total CtsB, and total Gapdh as a loading control in Smcr8+/+ and Smcr8−/− BMDMs. (E) Quantification of secreted CtsB levels in the BMDM conditioned medium. (*) P < 0.05 by two-tailed Student's t-test.

