
Figure 2.
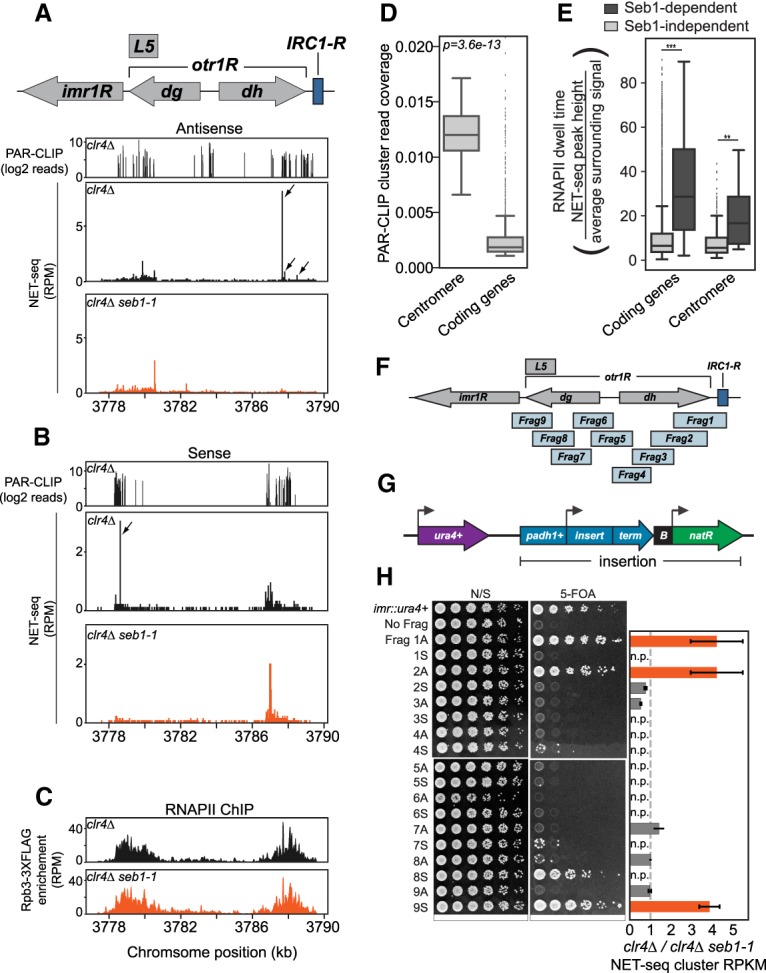
Seb1 directly binds to pericentromeric transcripts and induces RNAPII pausing in silencing-promoting segments. (A,B) Seb1 PAR-CLIP read clusters (log2 reads) and NET-seq peaks (reads per million mapped reads [RPM]) aligned to the right arm of centromere 1 in clr4Δ (PAR-CLIP) or comparing clr4Δ (black) and clr4Δ seb1-1 (red) strains (NET-seq). (A) Read clusters/peaks aligning to the antisense transcript. (B) Read clusters/peaks aligning to the sense transcript. Arrows indicate locations of Seb1-dependent NET-seq peak clusters identified computationally (see the Materials and Methods). (C) ChIP-seq (chromatin immunoprecipitation [ChIP] combined with high-throughput sequencing) data of Rpb3-3xFlag for the right arm of centromere 1, comparing RNAPII enrichment in clr4Δ (black) and clr4Δ seb1-1 (red). (D) Seb1 PAR-CLIP read cluster coverage at the centromeres compared with coding genes. (E) RNAPII dwell time analysis for centromeres and coding genes, comparing Seb1-dependent (dark gray) and Seb1-independent (light gray) pauses. (**) P = 0.0068; (***) P = 3.6 × 10−59. (F) Illustration of the right arm of centromere 1 and nine overlapping fragments analyzed. (G) Illustration of the reporter construct used to determine the silencing capacity of centromere fragments shown in F. (padh1+) adh1+ promoter; (term) a bidirectional terminator; (B) B-boxes boundary element; (natR) nourseothricin-resistance gene. The construct was placed downstream from ura4+. (H) Silencing assays for each fragment in antisense (A) or sense (S) orientations (spotting assay). Cells were plated on nonselective YS medium (N/S) and YS medium supplemented with 5-FOA (5-FOA). Controls for plating were a strain encoding a single functional ura4+ gene placed in the innermost repeats of centromere 1 (imr::ura4+) and a strain with the construct in G containing no fragment (No Frag). Ratios of clr4Δ/clr4Δ seb1-1 for NET-seq clusters in each fragment in antisense and sense transcription units (bar graph). Value of 1 represents no change in NET-seq signal (dotted line), and a value of >1 represents NET-seq clusters in clr4Δ that are reduced in clr4Δ seb1-1. Silencing-competent fragments are orange, and silencing-deficient fragments are dark gray. (n.p.) No peaks.