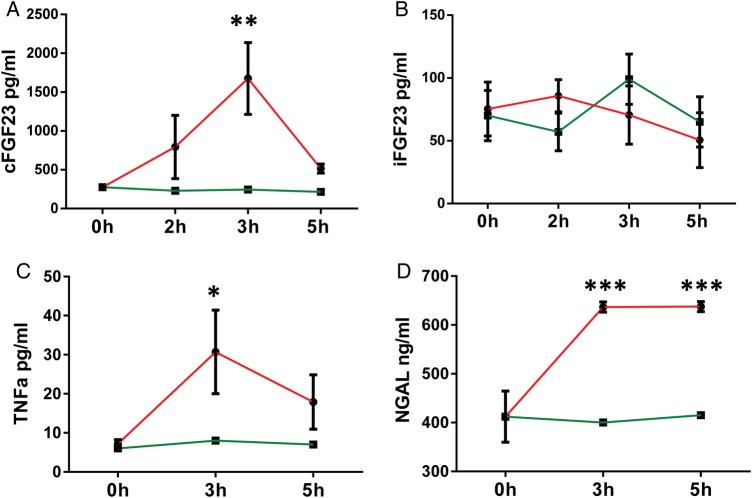
FIGURE 1.
Effect of acute inflammation on FGF3 regulation: acute inflammation was induced by a single injection (i.p.) of 3.3 μg/kg LPS and mice were sacrificed at hour 3 and 5. Plasma levels of (A) C-terminal FGF23, (B) intact FGF23, (C) TNF-α and (D) NGAL. Data are presented as mean ± SD, n = 4 per group. * P < 0.05 versus control, ** P < 0.01 versus control on ANOVA. Green line = vehicle, red line = LPS.

