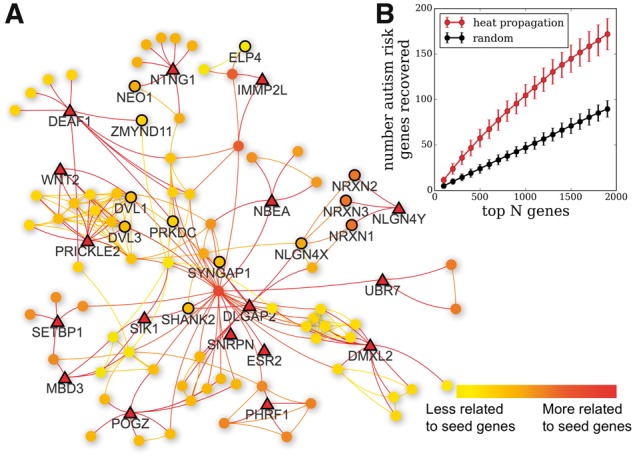
Fig. 1.

Network propagation visualization used to prioritize autism risk genes. (A) Autism sub-network, created by randomly selecting 25 known autism risk genes (triangles) as seeds for the heat propagation simulation. Here we display the largest connected component of the autism sub-network. Top 100 related genes are shown as circles, color-coded with decreasing propagated heat value (color online). Nodes with bold outlines are recovered autism risk genes. (B) Validation of heat propagation as method of gene prioritization. Top curve shows average number of autism risk genes in a set that are recovered in the top N genes based on propagation from 25 randomly selected genes in that set, while the bottom curve denotes the number of autism risk genes recovered in N randomly selected genes (Color version of this figure is available at Bioinformatics online.)
