Figure 1.
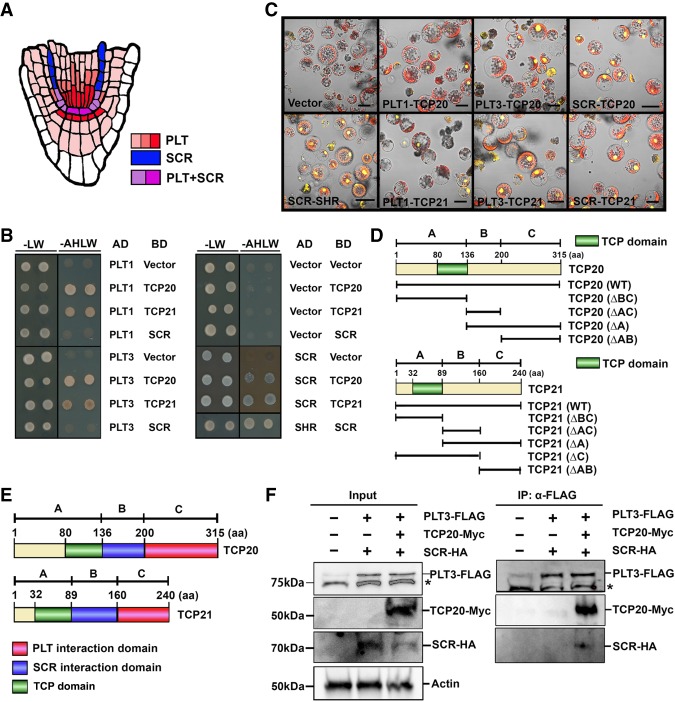
Protein interactions between TCPs and PLTs/SCR. (A) Scheme of PLTs and SCR protein expression in the Arabidopsis root apical meristem. PLTs are expressed broadly across the stem cell niche in the root (red), whereas SCR expression is restricted in the endodermis and QC cells (blue). The PLT and SCR expression domains overlap predominantly in QC cells and CEIs (purple). (B) Y2H assays between TCP20 or TCP21 and PLT1 or PLT3 or SCR were performed on SD/−Leu−Trp− Ade−His (−AHLW) medium for 4 d. SD/−Leu−Trp (−LW) medium was used as a growth control. Vector combination was used as a negative control, whereas SCR–SHR interaction was used as a positive control. (C) BiFC assay of the interaction between full-length PLT1 or PLT3 or SCR and TCP20 or TCP21 in Arabidopsis mesophyll protoplasts. Vector combination (vector) was used as a negative control, whereas SCR–SHR was used as a positive control. Bar, 30 µm. (D) Schematic presentations of the protein domains for truncated TCP20 and TCP21 used in Supplemental Figure 1, A–C. TCP domains are indicated in green. The numbers at the top indicate amino acids (aa). (E) The deduced domains of TCP protein binding to PLT (red), SCR (blue), and TCP domain (green). (F) Coimmunoprecipitation assay showing the positive interaction of PLT3–TCP20–SCR. 35S::PLT3-3xFlag, 35S::SCR-7xHA, and 35S::TCP20-10xMyc constructs were cotransfected in Arabidopsis mesophyll protoplasts and subjected to immunoprecipitation with anti-Flag antibody (IP:α-Flag), shown in the right panel. The left panel shows total cell lysate (input) from Arabidopsis mesophyll protoplasts expressing PLT3-Flag, SCR-HA, and TCP20-Myc followed by Western blot analysis. The presence of PLT3, SCR, and TCP20 was determined by anti-Flag, anti-HA, and anti-Myc antibody, respectively. Anti-actin antibody was used as a loading control. The asterisks indicate nonspecific bands. The original gel blot source is available in Supplemental Figure 1E.

