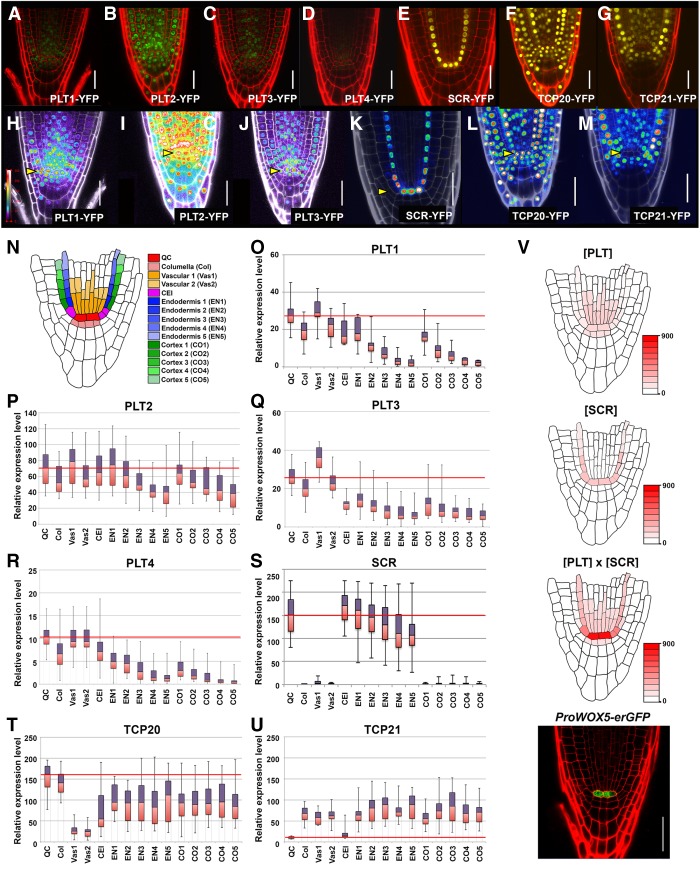
Figure 5.
PLT1, PLT3, and SCR protein levels in and around the stem cell niche. (A–G) pPLT1::PLT1-YFP, pPLT2::PLT2-YFP, pPLT3::PLT3-YFP, pPLT4::PLT4-YFP, pSCR::SCR-YFP, pTCP20::TCP20-YFP, and pTCP21::TCP21-YFP expression in 2-dag root apical meristems. All fluorescence signals of PLT1-YFP (A), PLT2-YFP (B), PLT3-YFP (C), and PLT4-YFP (D) seedlings roots at 2 dag were imaged using identical laser settings. (H–M) Heat maps showing fluorescence intensities corresponding to A–G. PLT1-YFP (H), PLT2-YFP (I), PLT3-YFP (J), SCR-YFP (K), TCP20-YFP (L), and TCP21-YFP (M) expression patterns are shown. (Yellow arrowheads) Positions of the QC cells. Bar, 20 µm. (N) Schematic transverse section depicting Arabidopsis root stem cells and their progeny. (O–U) Box plot of average fluorescence intensities over the root stem cell niche of 2-dag seedlings for all four PLTs, SCR, and two TCPs according to the color code in N. The red lines across the middle of the boxes identify the median sample values in QC cells. The number of seedlings used in these experiments: pPLT1::PLT1-YFP (n = 19; O), pPLT2::PLT2-YFP (n = 13; P), pPLT3::PLT3-YFP (n = 45; Q), pPLT4::PLT4-YFP (n = 20; R), pSCR::SCR-YFP (n = 42; S), pTCP20::TCP20-YFP (n = 18; T), and pTCP21::TCP21-YFP (n = 20; U). (V) The overlap between PLT and SCR using expression levels from O, Q, and S and synergy data from Figure 6E ([PLT] × [SCR]) establishes a stronger enriched domain of QC specification and WOX5 expression in the stem cell niche than PLT or SCR alone ([PLT] or [SCR]). Red implies the highest expression of WOX5. The actual pWOX5-erGFP expression pattern in wild type (ProWOX5-erGFP). Bar, 30 µm.

