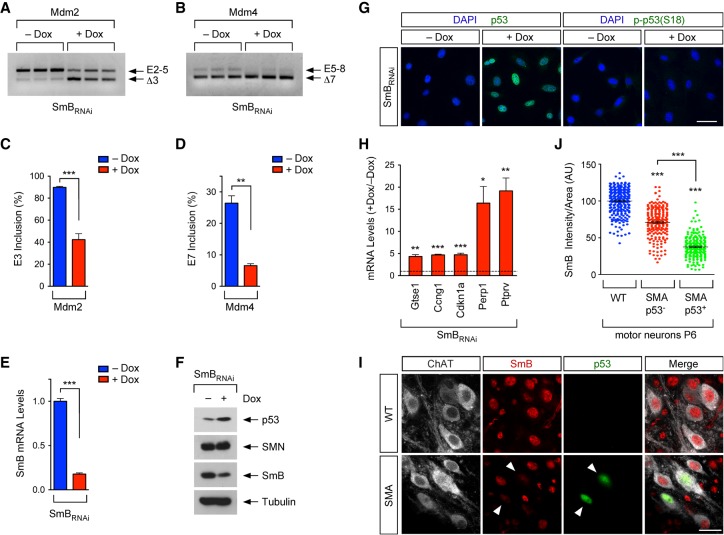
Figure 2.
Defective snRNP biogenesis dysregulates Mdm2 and Mdm4 alternative splicing and induces p53 activation. (A) RT–PCR analysis of Mdm2 exon 3 splicing in NIH3T3-SmBRNAi cells cultured with or without Dox using exon 2 (E2) and exon 5 (E5) primers. (B) RT–PCR analysis of Mdm4 exon 7 splicing in NIH3T3-SmBRNAi cells cultured with or without Dox using exon 5 (E5) and exon 8 (E8) primers. (C) The percentage of Mdm2 exon 3 inclusion from RT–PCR data in A. Data represent mean and SEM. n = 3. (D) The percentage of Mdm4 exon 7 inclusion from RT–PCR data in B. Data represent mean and SEM. n = 3. (E) RT-qPCR analysis of SmB mRNA levels in NIH3T3-SmBRNAi cells cultured with or without Dox. Data represent mean and SEM. n = 3. (F) Western blot analysis of NIH3T3-SmBRNAi cells cultured with and without Dox. (G) p53 and phospho-p53S18 immunostaining of NIH3T3-SmBRNAi cells cultured with or without Dox. Bar, 50 µm. (H) RT-qPCR analysis of mRNA levels of p53 transcriptional targets in NIH3T3-SmBRNAi cells cultured with or without Dox. Normalized data from Dox-treated cells relative to untreated cells are shown as mean and SEM. n = 3. (I) ChAT, SmB, and p53 immunostaining of L2 spinal segments from wild-type and SMA mice at P6. Bar, 25 µm. Arrowheads point to p53+ SMA motor neurons. (J) Normalized SmB fluorescence intensity in wild-type as well as p53+ and p53− SMA L2 motor neurons at P6 from experiments as in I. Each point represents SmB fluorescent intensity in a single L2 motor neuron, and data were collected from three mice. Statistics were performed with two-tailed unpaired Student's t-test (C,D,E,H) or one-way ANOVA with Tukey's post-hoc test (J). (*) P < 0.05; (**) P < 0.01; (***) P < 0.001.

