Figure 1.
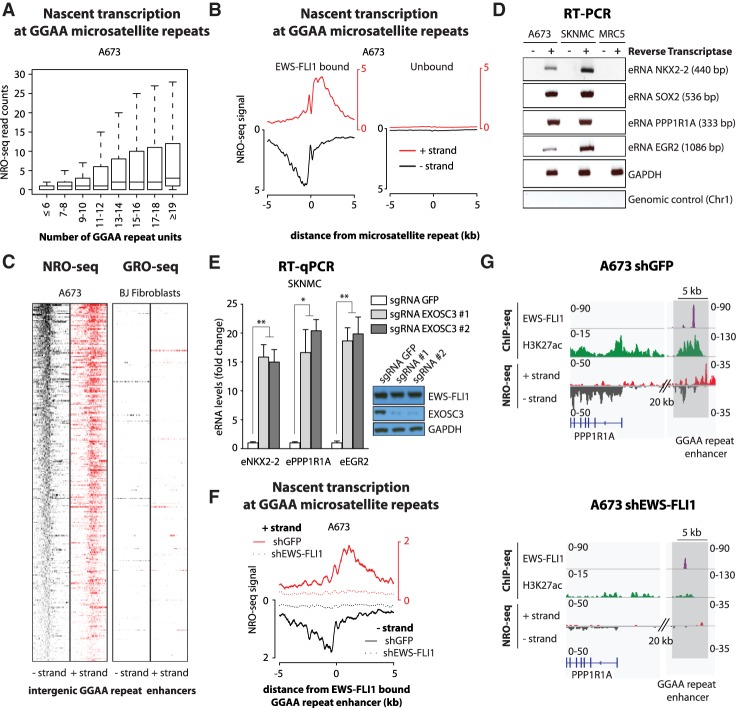
EWS-FLI1-bound GGAA microsatellite repeats are transcriptionally active. (A) Box plots show NRO-seq read counts at intergenic GGAA microsatellite repeats in A673 Ewing sarcoma cells based on the number of consecutive repeats. Reads were counted in a 1-kb window centered on GGAA microsatellite repeats. (B) Composite plots show NRO-seq signals at intergenic GGAA repeats that are either EWS-FLI1-bound (n = 473; left) or unbound (n = 7232; right) in A673 Ewing sarcoma cells. The X-axis represents a 10-kb window centered on GGAA microsatellite repeats. (C) Heat maps show NRO-seq signal density in Ewing sarcoma A673 cells (left) and GRO-seq signal density in BJ fibroblasts (right) at the top 300 transcriptionally active intergenic EWS-FLI1-bound GGAA repeats in A673 cells. Ten-kilobase windows in each panel are centered on EWS-FLI1-bound GGAA repeats. (D) RT–PCR shows the detection of eRNAs at EWS-FLI1-bound GGAA repeats in Ewing sarcoma cells A673 and SKNMC. MRC5 fibroblasts were used as negative control cells. Additional negative controls lack reverse transcriptase or map to a nontranscribed region on chromosome 1. GAPDH was used as a positive control of reverse transcription. Amplicon sizes are indicated in parentheses. (E) RT-qPCR shows the increased detection of eRNAs at EWS-FLI1-bound GGAA repeats in SKNMC cells expressing Cas9 and single-guide RNAs (sgRNAs) targeting the EXOSC3 coding sequence. (Inset) EXOSC3 and EWS-FLI1 protein levels assessed by immunoblotting in the same experiments. GAPDH was used as loading control. Cells were collected 7 d after lentiviral transduction. (F) Composite plots show NRO-seq signals at intergenic EWS-FLI1-bound GGAA repeats (n = 473) in A673 cells 96 h after infection with either a control shRNA (plain line) or a shRNA targeting FLI1 (dotted line). Enhancers found in intragenic regions or <5 kb from genes expressed in Ewing sarcoma were removed from consideration. The X-axis represents a 10-kb window centered on EWS-FLI1-bound GGAA microsatellite repeats. (G) Example shows decreased nascent transcription at an EWS-FLI1-bound GGAA repeat enhancer near PPP1R1A in A673 cells infected with either a control shRNA (left) or a shRNA targeting FLI1 (right). ChIP-seq (chromatin immunoprecipitation [ChIP] combined with high-throughput sequencing) tracks of FLI1 (EWS-FLI1), H3K27ac, and NRO-seq. Regions of interest are highlighted in light gray. (*) P-value < 0.05; (**) P-value < 0.01. See also Supplemental Figures S1 and S2.

