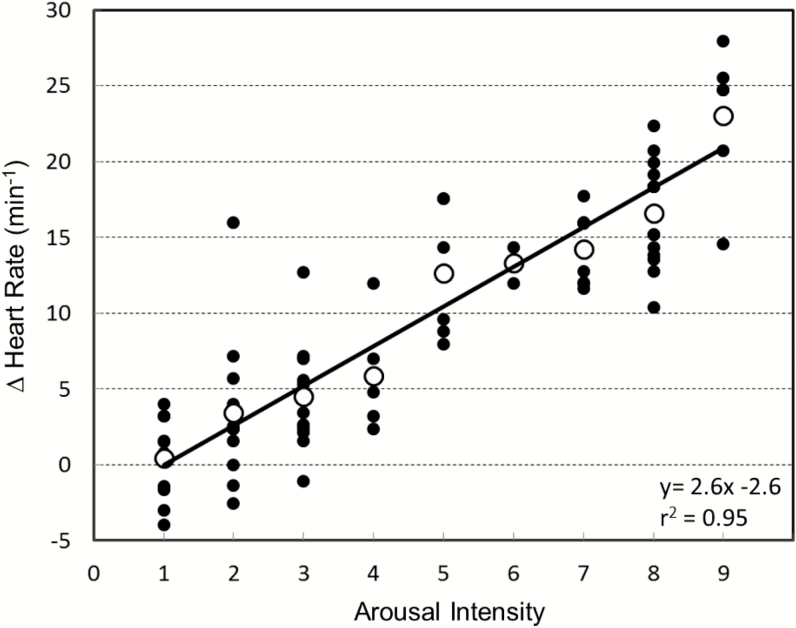
Figure 2.
Change in heart rate with the arousal (ΔHR) at different arousal intensities in a representative subject. Each solid dot is the ΔHR with each arousal and each open dot is the average ΔHR at a given arousal intensity. The equation of best-fitted regression line to the average HR responses is y = 2.6x − 2.6. The arousal intensity threshold for ΔHR is 1.0.

