
Figure 1.
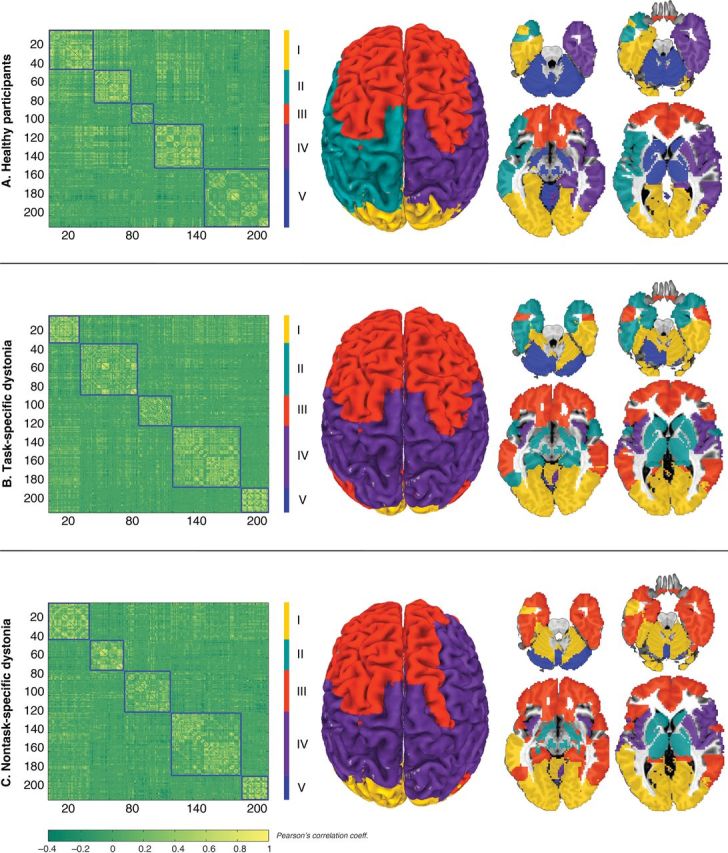
Large-scale community architecture derived from modular decomposition of the group-averaged networks in ( A ) healthy participants, ( B ) patients with task-specific dystonia, and ( C ) patients with nontask-specific dystonia. Left panel shows 212 × 212 connectivity matrices averaged across each group with the corresponding community partitions. The color bar represents r values based on Pearson's correlation coefficients between each pair of regions. The right panel shows the regional distribution of neural communities on a standard brain in the Talairach–Tournoux space. The 5 network modules are color-coded as follows: yellow = Module I, green = Module II, red = Module III, purple = Module IV, blue = Module V.