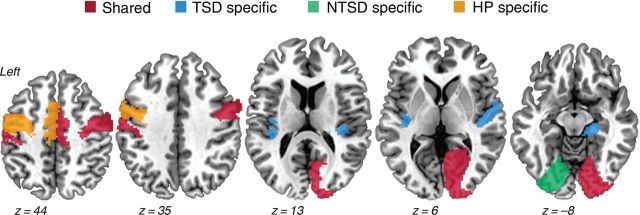
Figure 2.
Distribution of shared and distinct hubs. High-strength/high-degree hubs common to healthy participants (HP), patients with task-specific dystonia (TSD), and nontask-specific dystonia (NTSD) are shown in red; hubs unique to TSD patients are shown in blue; hubs unique to NTSD patients are shown in green, and hubs unique to HP are shown in orange. Brain sections are shown as a series of axial slices of a standard brain in the Talairach–Tournoux space.

