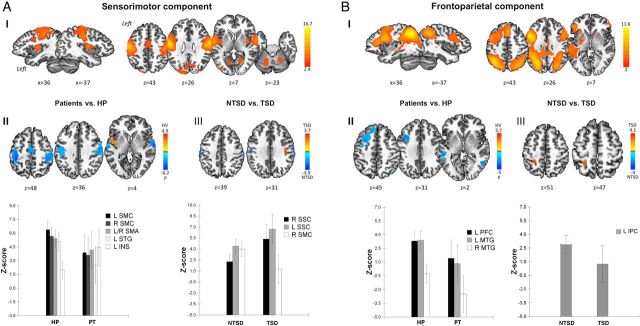
Figure 3.
Resting-state functional network alteration assessed using ICA. Panels ( A-I ) and ( B-I ) represent the extracted components relevant to dystonia across all patients and healthy participants ( A-I for the sensorimotor and B-I for frontoparietal independent components). For each component, voxel-based inferential statistics were used to compare ( II ) all patients vs. healthy participants, and ( III ) TSD vs. NTSD groups. Statistical maps are superimposed on axial and sagittal sections of a standard brain in Talairach–Tournoux space. The color bars represent Z -scores for independent components and t scores for group statistical comparisons ( P ≤ 0.05, FWE-corrected). The corresponding bar graphs of the group-averaged resting-state connectivity in the significant clusters are shown in the bottom row of the figure. SMC, sensorimotor cortex; STG, superior temporal gyrus; INS, insula; SSC, somatosensory cortex; PFC, prefrontal cortex; MTG, middle temporal gyrus; IPC, inferior parietal cortex.

