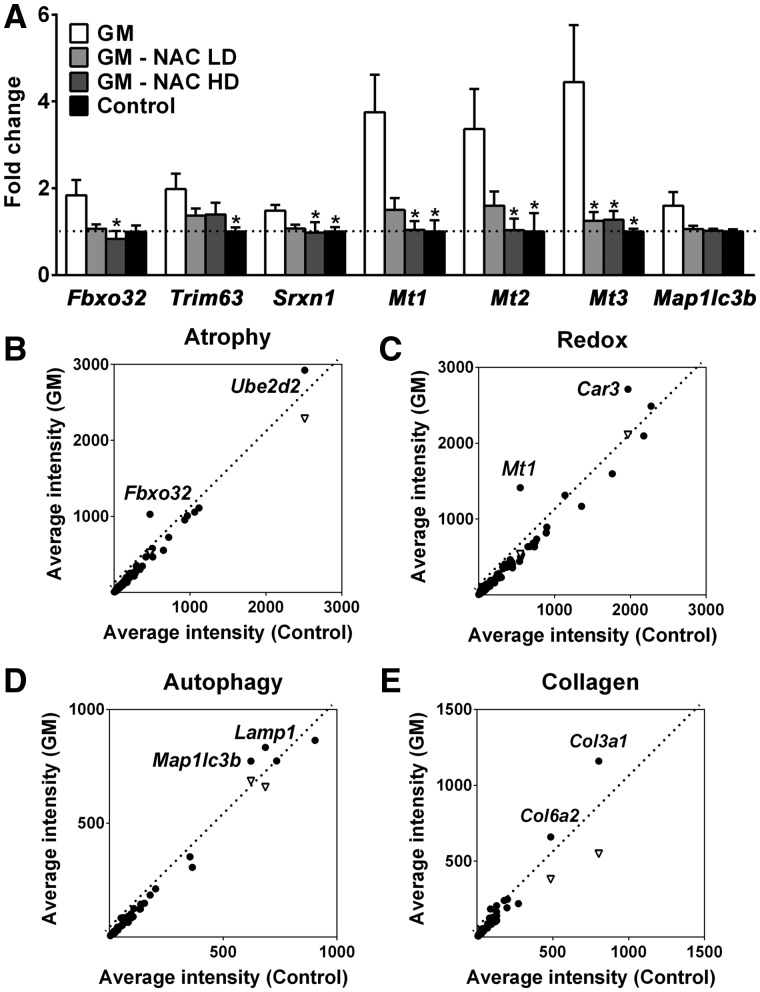
Figure 2.
Upregulation of atrogenes and oxidative stress-responsive genes in GNE myopathy muscles. (A) Expression of Fbxo32, Trim63, Srxn1, Mts, and Map1lc3b in untreated (white bars, n = 17), high dose (HD, 1.0%) or low dose (LD, 0.1%) N-acetylcysteine (NAC) treated (gray bars, n = 6 per group), and littermate controls (black bars, n = 6) as fold changes of littermate controls. Data represent mean ± SEM of each group. *P < 0.05. (B-E) Microarray analysis followed by gene ontology profiling: (B) muscle atrophy-related genes, (C) oxidative stress and redox homeostasis-related genes, (D) autophagy-related genes, (E) collagen-related genes. Each dot represents average expression values for the same gene from GNE myopathy (vertical axis, n = 9) and littermates (horizontal axis, n = 3) muscles. Inverted triangles show recovered expression values with N-acetylcysteine treatment (vertical axis, n = 6) for significantly upregulated genes.

