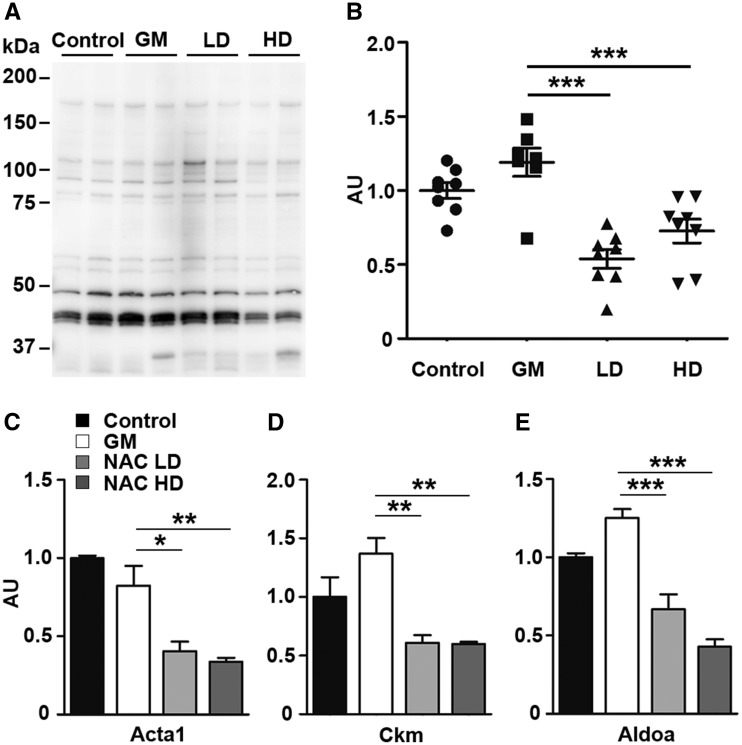
Figure 8.
Reduction of S-nitrosyl modification in skeletal muscle proteins by N-acetylcysteine treatment. (A) Profiles of S-nitrosylation of mouse skeletal muscle proteins. (B) Total S-nitrosylation rates nomalized by protein amounts. (C–E)S-nitrosylation rates of skeletal muscle: (C) actin (Acta1), (D) muscle creatine kinase (Ckm), (E) fructose-bisphosphate aldolase A (Aldoa). Control, untreated controls (n = 8); GM, untreated GNE myopathy mice (n = 7); LD/NACLD, GM with low dose of N-acetylcysteine (n = 8); HD/NACHD, GM with high dose of N-acetylcystine (n = 8). Data presented with mean ± SEM. *P < 0.05; **P < 0.01; ***P < 0.001.

