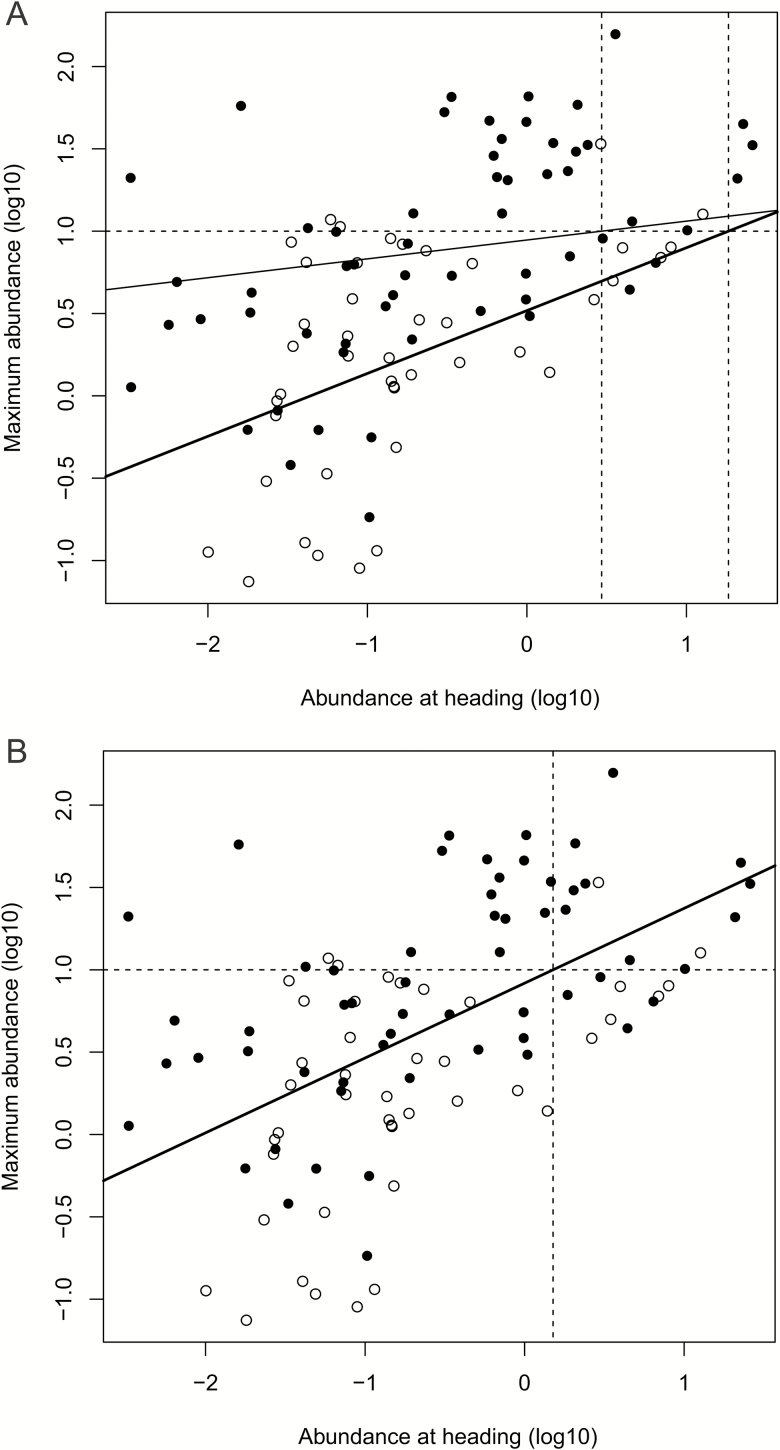
Fig. 4.
Regression of maximum abundance (log10[individuals/tiller]) of Metopolophium dirhodum in particular subplots on abundance at heading. (A) Separate models for sparse and dense stands, (B) model combining dense and sparse stands. Solid lines—trend lines as predicted by the LME models, thick lines indicate slopes significantly different from 0; dashed horizontal line—economic threshold of 10 aphids/tiller at maximum abundance; dashed vertical lines—critical abundance at heading as predicted by the models. Closed symbols—sparse stands; open symbols—dense stands.

