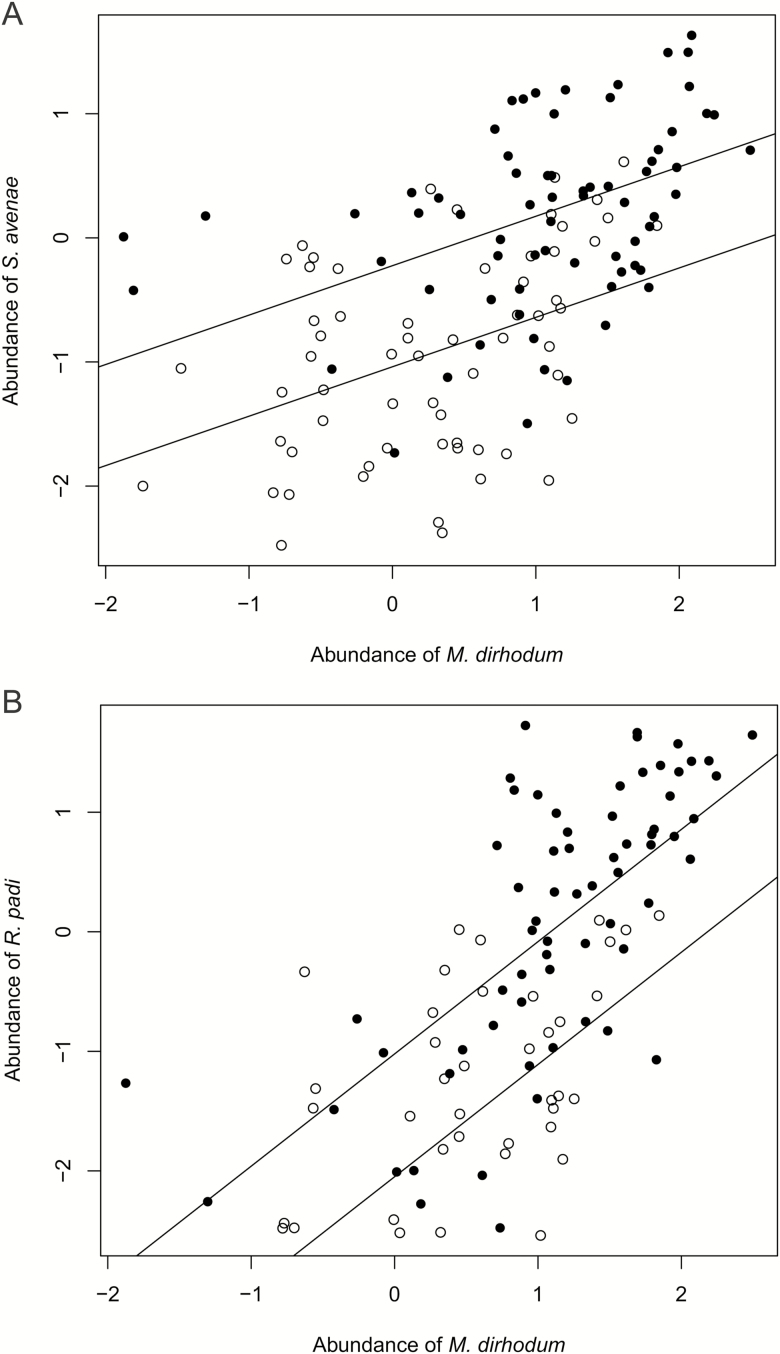
Fig. 5.
Regression of maximum abundance (log10[individual/tiller]) of (A) Sitobion avenae and (B) Rhopalosiphum padi on maximum abundance of Metopolophium dirhodum in particular subplots. Solid lines—trend lines as predicted by the LME models. Closed symbols—sparse stands; open symbols—dense stands. Data for subplots where both species have nonzero abundance.

