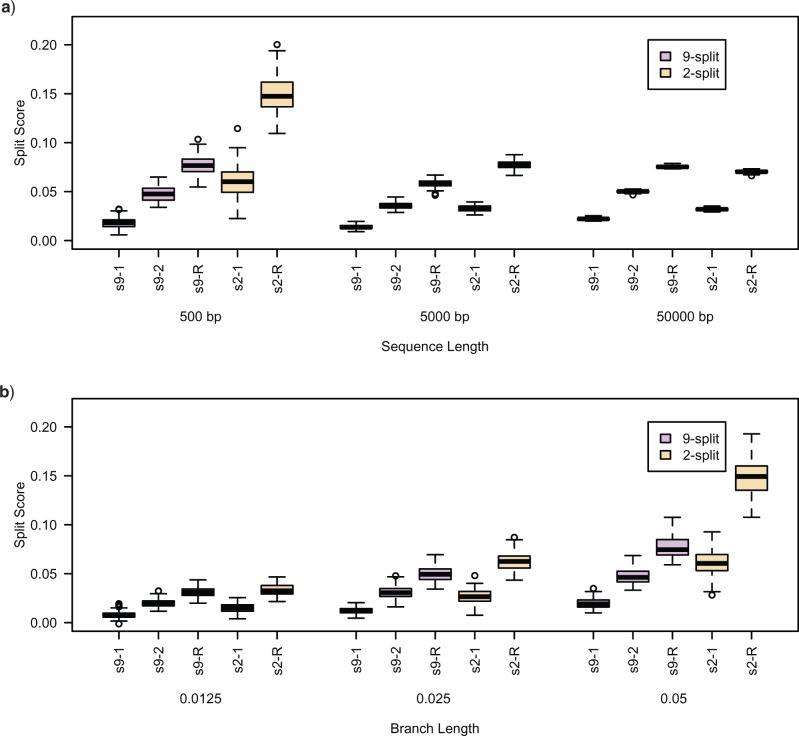
Figure 6.
(a) Differences (false-split-score minus true-split-score) for true 9- and 2-splits associated to two edges of tree  of Figure 1, from sequences of length 500, 5000, 50,000 bp simulated on
  according to the Jukes–Cantor model, with all edge lengths 0.05. Each boxplot represents differences for 100 replicates. See Simulation Study 2 methods for choices of false and true splits. In these simulations the differences were always positive, illustrating that split scores for true splits are the smallest over a range of sequence lengths. (b) Boxplots illustrating the distribution of the score differences as in (a), but with sequence length 500 bp and all branch lengths set to
  ,
,  ,
,  . Across this range of branch lengths, with a single exception (one simulation for s9-1 and length 0.0125), the true split score was always the smallest. (See online for color.)

