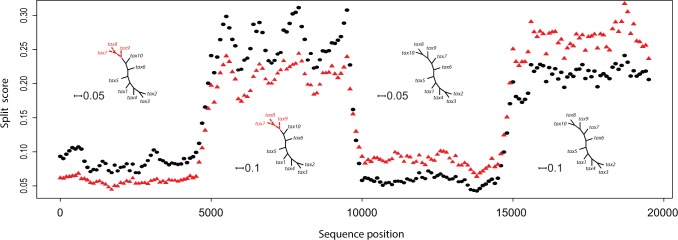
Figure 8.
The values of the scores for the split {7–9}  {7–9} are shown as red triangles, and for the split {8–10}
  {8–10} as black dots. The scores were computed by scanning along the 20,000 bp simulated genome and computing scores for the {7–9} grouping and {8–10} grouping for segments of length 500 bp at a slide size of 100 bp. For each 100 bp—
 —on the
  -axis, both scores for the 500 bp window beginning at that site in the genome are plotted. The score detects both the true split in the tree used to generate the sequence data, and the shift in branch lengths. (See online for color.)

