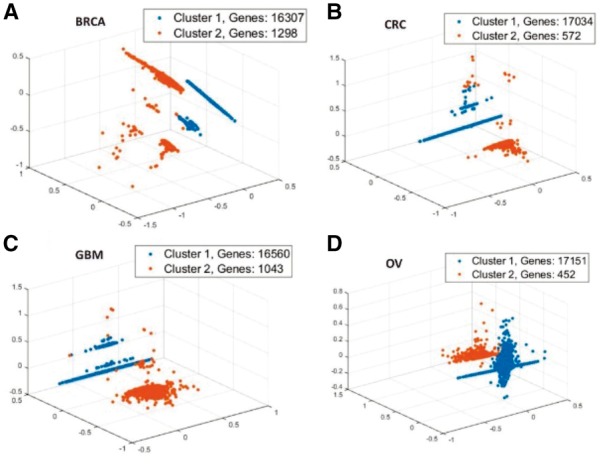
Fig. 2.

Cluster visualization with iDriver-Clust on different tumor types. In order to do the visualization, firstly, linear dimensionality reduction use Principal component analysis keeping only the most significant vectors to project the data to a 3-dimensional space. Then, get clusters of all genes by choosing the component that has max posterior probability on TCGA datasets of four tumor types: (A) BRCA, (B) CRC, (C) GBM and (D) OV
