Figure 2.
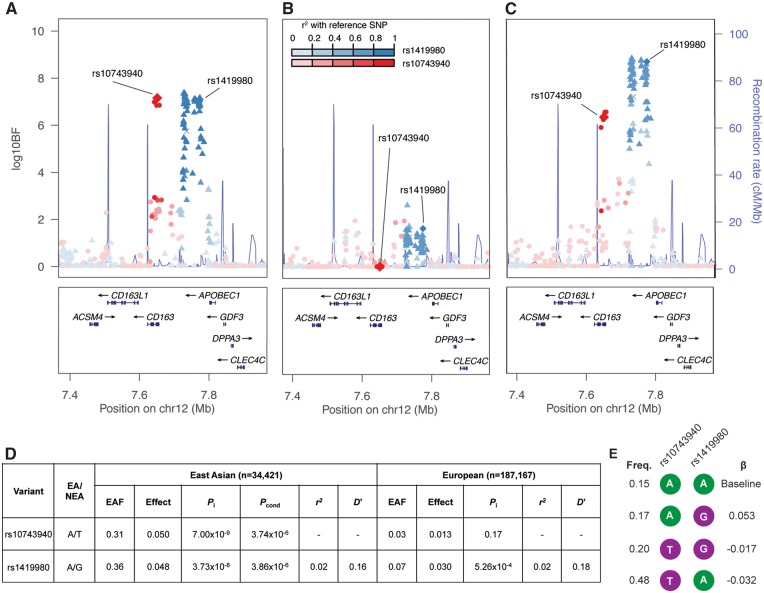
HDL-C locus CD163-APOBEC1 exhibits two signals. (A) The two signals, rs10743940 and rs1419980, identified in Phase 2 of the East Asian meta-analysis, shown with the log10BF on the y-axis. (B) log10BF results from the GLGC European data showing the variant associations at the locus. (C) Trans-ancestry meta-analysis. Variants are colored based on LD with the lead variants, rs10743940 (red) and rs1419980 (blue) based on 1000 Genomes Project Phase 3 East Asian (A) and European (B and C) LD. (D) Fixed effect association results at two lead variants (rs10743940 and rs1419980) in East Asians and Europeans. Pinitial is the P value result from the unconditioned analysis. Pconditional is the joint conditional P value for each variant after conditioning on the other variant. (E) Haplotypes of rs10743940 and rs1419980 in the China Health and Nutrition Survey data. Alleles associated with lower HDL-C are shown in purple while alleles associated with higher HDL-C are shown in green. Haplotype association was performed with HDL-C inverse normalized residuals after adjusting for age, age2, sex, and BMI from the China Health and Nutrition Survey study using the most frequent haplotype as the reference.

