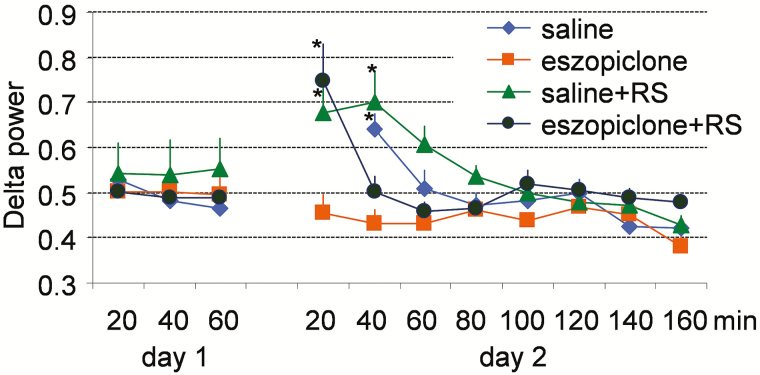
Figure 5.
NREM sleep SWA profile on the baseline day (day 1) and on the injection day (day 2) in mice. Zero minutes correspond to ZT6, the time when injections occurred on day 2. Results are shown as the mean ± SEM. *p < .05 versus the same group of mice on day 1. NREM = nonrapid eye movement; SEM = standard error of the mean; SWA = slow wave activity.

