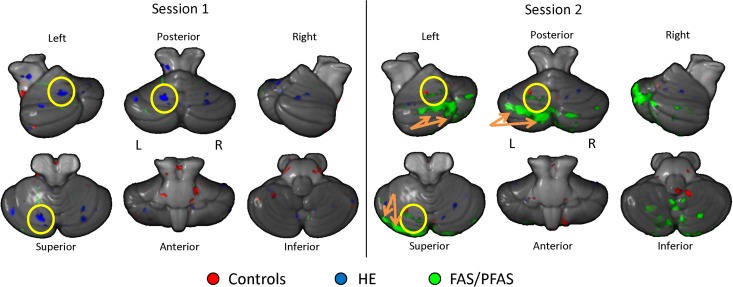
Figure 3.
Learning-related cerebellar regions of activation shown for all 3 groups (red: controls, blue: HE, green: FAS/PFAS). Clusters represent greater activation during conditioning sessions 1 and 2 relative to unpaired sessions. Yellow circles indicate left hemispheric lobule VI activation and orange arrows indicate Crus I and II activity.

