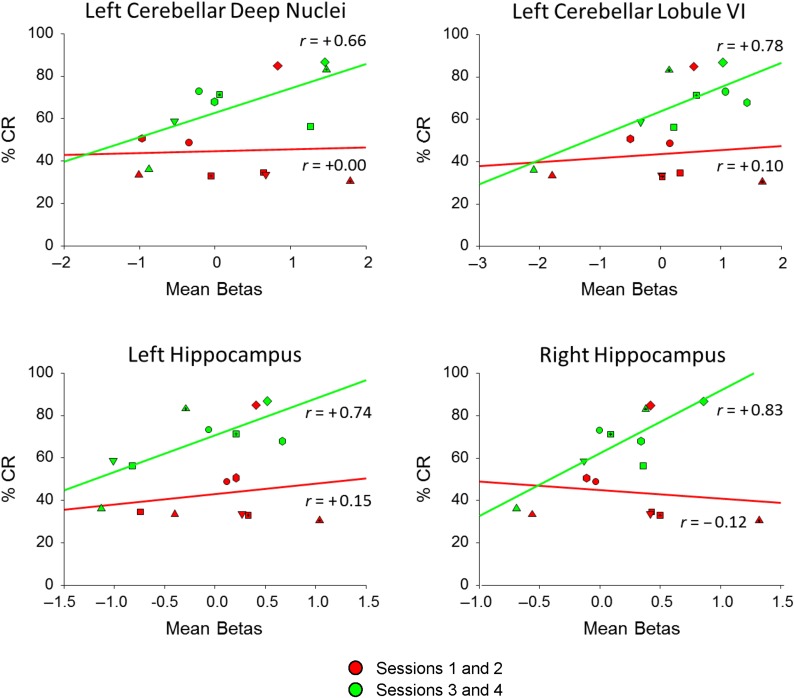
Figure 6.
Scatterplots with regression lines for the control group showing the relation of regional brain activation to CR. Early (red) session (1 and 2) behavior was not correlated with brain activity while late (green) session (3 and 4) behavior was positively correlated. Unique data plots represent individual subjects.

