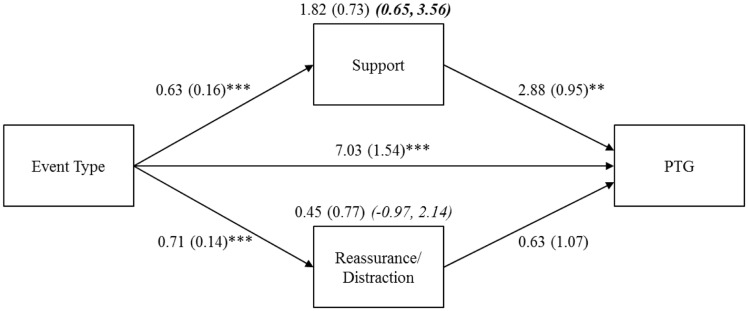
Figure 1.
Path analysis model using a multiple mediator ordinary least squares regression analysis, predicting PTG from event type through its effect on perceptions of parents’ reactions. Unstandardized coefficients and standard errors are presented, with indirect effects and their confidence intervals (italicized) presented above the respective mediators. Significant indirect effects are bolded. PTG = posttraumatic growth. Cancer treatment intensity rating and years since diagnosis were included as covariates. **p < .01, ***p < .001.

