Figure 1.
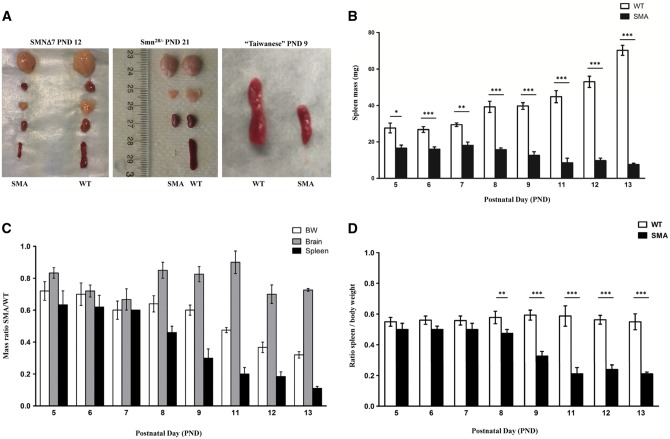
SMA spleens exhibit severe and progressive size reduction (A) Organs harvested from WT (right) and SMA (left) of late symptomatic SMNΔ7 (left panel), late symptomatic Smn2B/- mice (middle) at PND 21, and late symptomatic “Taiwanese” SMA mice at PND 9 (right panel). (B) Spleen weights from pre- (PND 5), to late (PND 13) symptomatic time points of SMNΔ7 SMA and WT littermates control mice. Spleens are significantly smaller than control spleens at all time points. (C) Mass ratio of SMA to WT for body weight (BW), brain, and spleen (SP). SMA spleens are disproportionately smaller than WT spleens. (D) Ratio of spleen mass to body weight. The WT spleens are growing proportionally with the body, SMA spleens start to regress after PND 7. (n = 4 to 6 for each genotype at each time point) (*P < 0.005, **P < 0.01, ****P < 0.001).

