Figure 3.
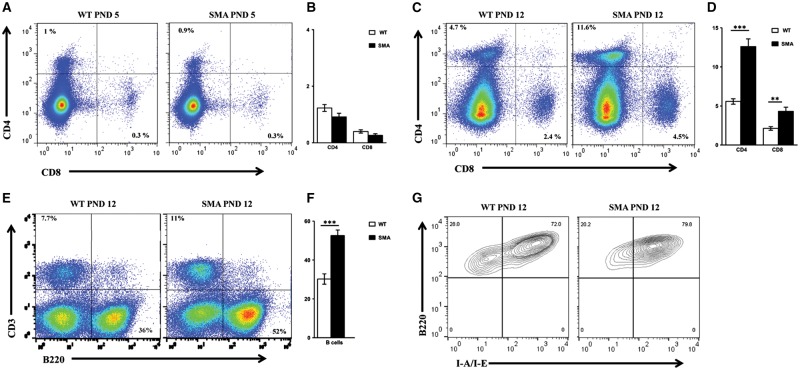
Higher frequency of lymphocytes in SMNΔ7 SMA spleens. (A) Total splenocytes from individual WT (left) and SMA (right) spleens of SMNΔ7 mice at PND 5 were surface labeled. Frequency of (CD4+, CD8-) and (CD4-, CD8+) T cells are indicated relative to the total live splenocytes in representative FACS plots. (B) Bar graph showing the mean percentages of CD4+ and CD8+ T lymphocytes ± SEM for three mice per group. (C,D) are the same as in (A) and (B) respectively for splenocytes from mice at PND 12 (n = 7 for each group). (E) Total splenocytes from individual WT (left) and SMA (right) spleens of SMNΔ7 mice at PND12 were surface labeled. Frequencies of B lymphocytes (CD3-, B220+) are indicated relative to the total live splenocytes in representative FACS plots. (F) Bar graph showing the mean percentages ± SEM for 10 mice per group. (G) To study the level of expression of MHC class II on B cells, total splenocytes from individual WT (left) and SMA (right) spleens were stained with anti-I-A/I-E (MHC II) and analyzed by flow. Frequencies of (B220+ I-A/I-E+) subsets are indicated relative to (CD3-, B220+) splenocytes in representative FACS plots.

