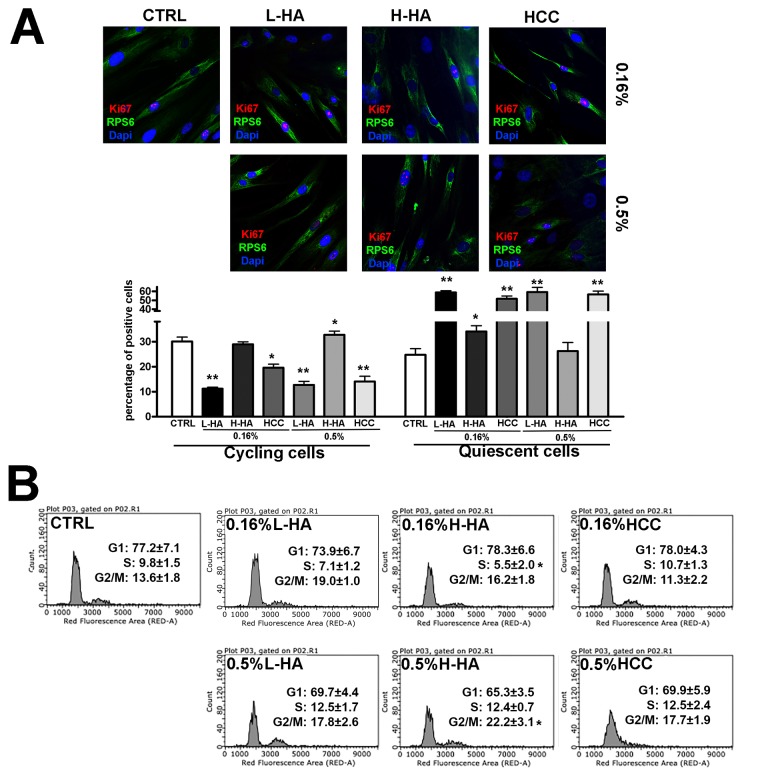
Figure 1.
(A) Representative microscopic field of Ki67 immunostaining (red) and pRPS6 (green) on MSCs grown in the presence of different hyaluronan mixtures. Nuclei were counterstained with Hoechst 33342 (blue). The graph shows the percentage of Ki67(+) pRPS6(+) cycling cells and Ki67(-) pRPS6(-) quiescent cells. Data are expressed with standard deviation (n = 3, *p<0.05, **p<0.01). (B) The picture shows representative FACS analysis of MSCs grown in the presence of different hyaluronan mixtures. Experiments were conducted in triplicate for each condition. Percentages of different cell populations (G1, S, and G2/M) are indicated. Data are expressed with standard deviation (n = 3, *p<0.05).

