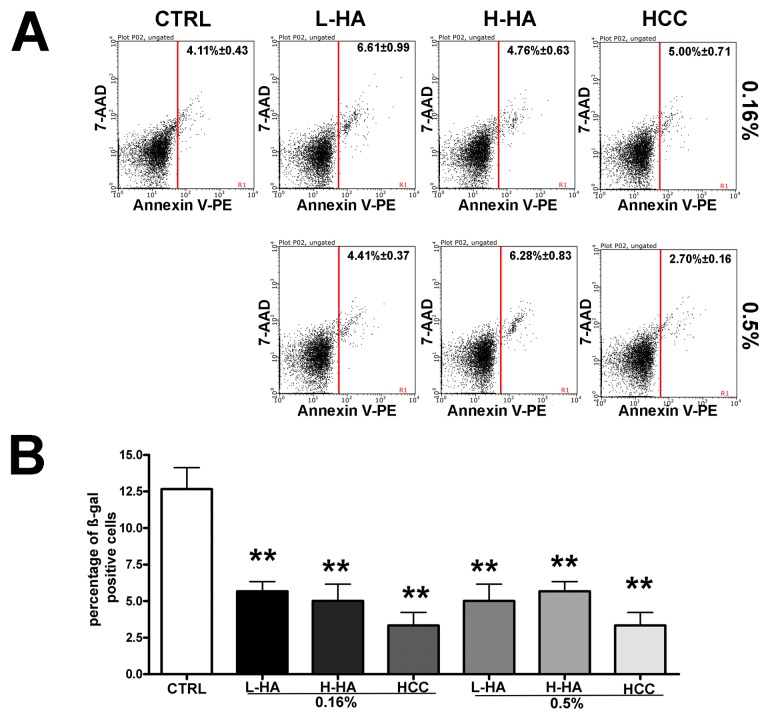
Figure 2.
(A) Flow cytometry analysis of apoptosis with Annexin assay. The assay allows the identification of early (Annexin V + and 7ADD -) and late apoptosis (Annexin V + and 7ADD +). Nevertheless, apoptosis is a continuous process, and we calculated the percentage of apoptosis as the sum of early and late apoptotic cells. For every experimental condition, the percentage of apoptotic cells is indicated in the upper right corner of the analysis plot. Data are expressed with standard deviation (n = 3, *p<0.05). (B) Acid beta-galactosidase Senescence assay. The graph shows the mean percentage value of senescent cells in every experimental condition (± SD, n = 3, *p<0.05).

