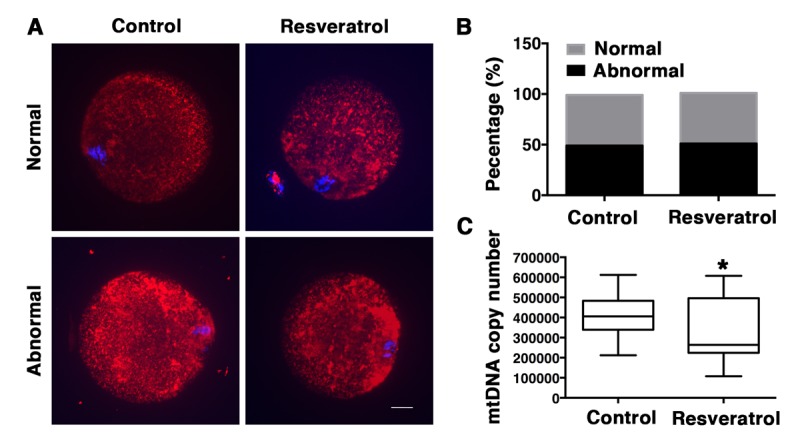
Figure 5.

Analysis of mitochondrial distribution and mtDNA copy number in MII oocytes during aging in vivo. (A) Confocal microscopy images of normal and abnormal mitochondrial distribution patterns in oocytes recovered from control and resveratrol-treated mice. Mitochondrial distribution patterns were detected using Mito Tracker Red. DNA was counterstained with Hoechst (blue). Scale bar: 10 μm. (B) Percentages of the normal and abnormal distribution patterns in control or resveratrol-treated oocytes, respectively. (C) The average copy number of mitochondrial DNA in control and resveratrol-treated oocytes. Data are expressed as mean ± SEM of at least 3 independent experiments. *Significantly different (P < 0.05).
