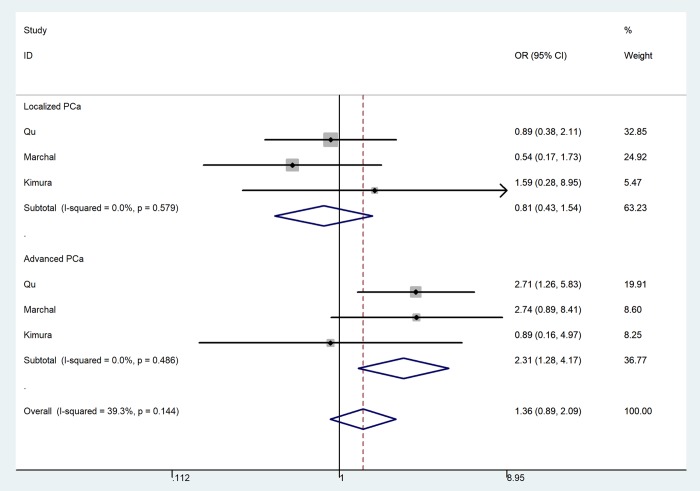
Figure 4.
Forest plot of prostate cancer risk associated with the MTR A2756G polymorphism (recessive model of GG vs. GA+AA, fixed-effects) in the stratified analyses by tumor stage. The squares and horizontal lines represent the study-specific OR and 95% CI. The area of the squares reflects the weight (inverse of the variance). The diamond corresponds to the summary OR and 95% CI.

