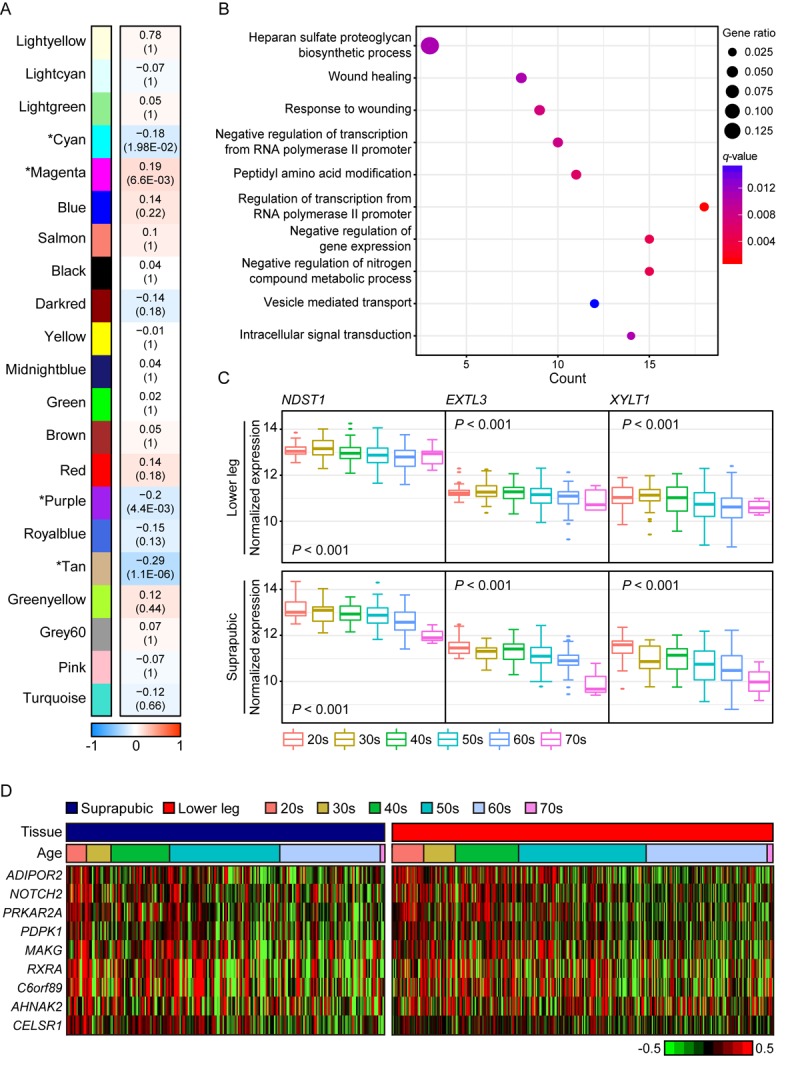
Figure 3.

The common gene expression changes with aging in suprapubic and lower leg tissues. (A) Module trait relationship of constructed modules from lower leg. The statistically significant modules were marked with asterisk. The correlation values and Bonferroni-corrected P-values (in the bracket) were marked. (B) Pathway enrichment analysis of tan module. Top 10 the most enriched pathways were used. (C) The changes in gene expression level of three genes that play a role in heparan sulfate proteoglycan biosynthetic process in both tissues were shown. (D) Heatmap displays the expression level of nine genes that play a role in wound healing process in both tissues.
