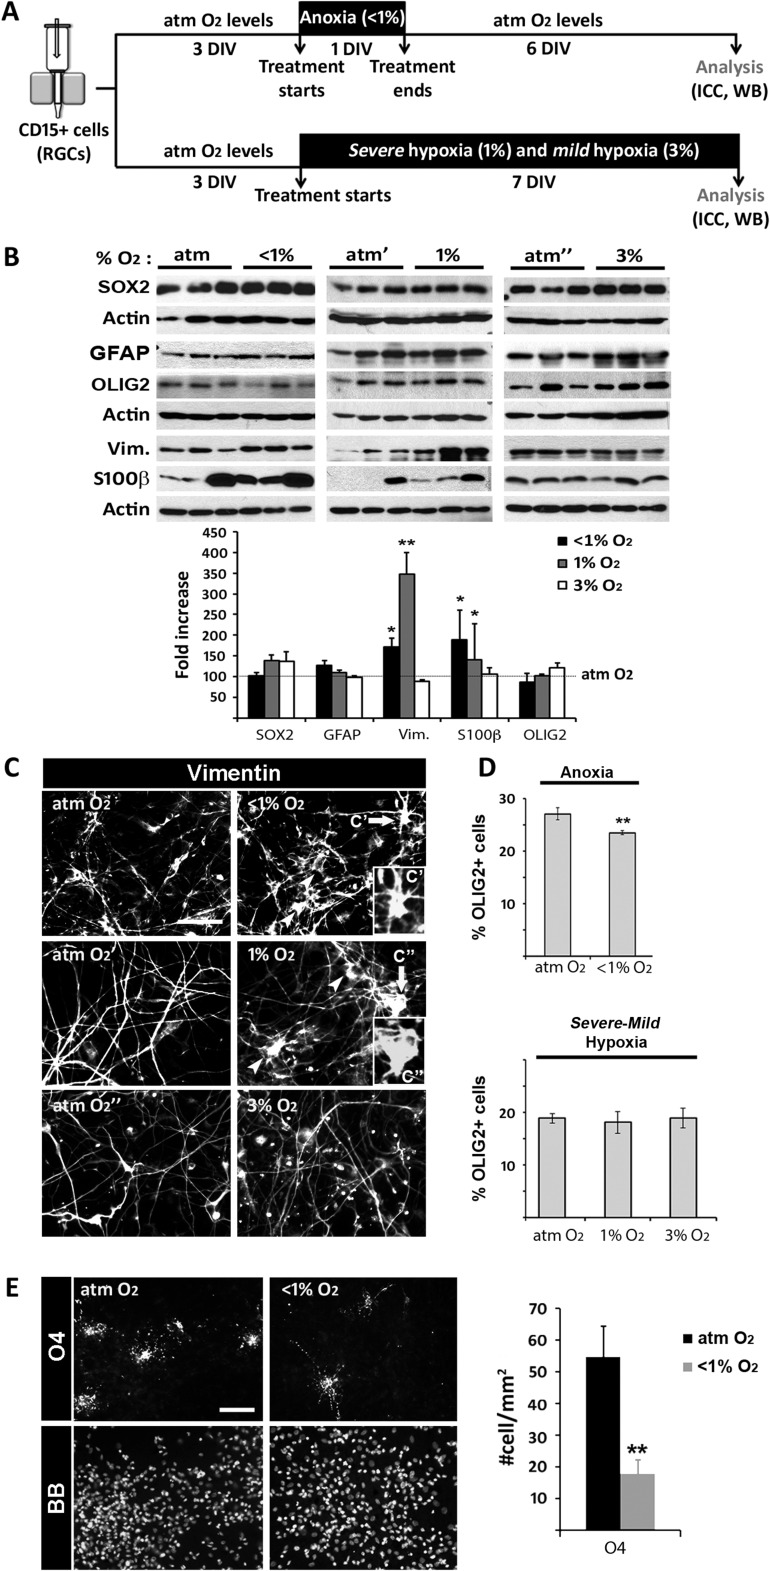
Figure 5.
The effect of hypoxic stimuli on glial development. (A) Timeline of the experimental procedure. (B) Western blots show a significant increase in the amount of Vimentin and S100β, but not of other markers of RGCs (SOX2), astroglia (GFAP), or oligodendrocytes (OLIG2) in RGC cultures exposed to anoxia or severe hypoxia versus control cultures (atm O2). Histogram shows the fold increase of the densitometric values obtained in the tested conditions versus atmospheric control set to 100. Actin served as a loading control. (C) Vimentin labeling shows more reactive astroglial morphologies in anoxia and 1% O2 hypoxia than in control conditions (arrowheads; in inset, higher magnification images C′ and C′′ pointed to by arrows). (D) Slight decreases in OLIG2+ cells percentages in RGC cultures exposed to anoxia but not to chronic 1% and 3% O2 hypoxia, compared with control cultures. (E) Reduction of O4+ cells is observed in anoxic versus control cultures. Cell nuclei were labeled with BB. Scale bars: C, F, 50 µm; D, 20 µm. *P < 0.05, **P < 0.01: significant difference between conditions and individual human samples determined by paired t-test and ANOVA. A minimum of three different human cell samples were used per condition. Error bars indicate the SEM.

