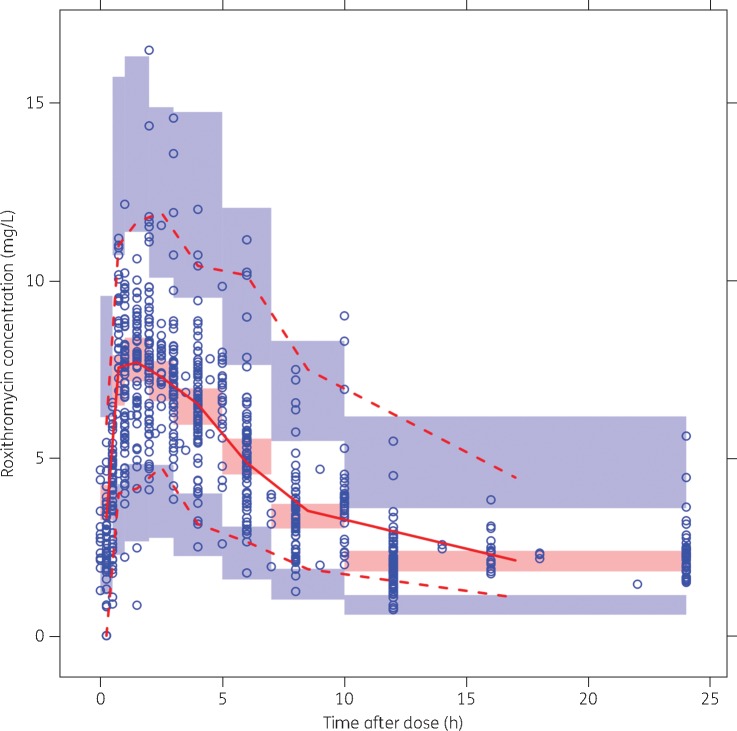
Figure 3.
pcVPC of the final model. Prediction-corrected observed concentrations are shown as open circles, with the continuous and lower and upper broken lines showing the median and the 2.5th and 97.5th percentiles of the observed data, respectively. The shaded areas represent 95% inclusion intervals for the model-predicted median and 2.5th and 97.5th percentiles constructed from 1000 simulated datasets of individuals from the original dataset. This figure appears in colour in the online version of JAC and in black and white in the print version of JAC.

