Figure 1.
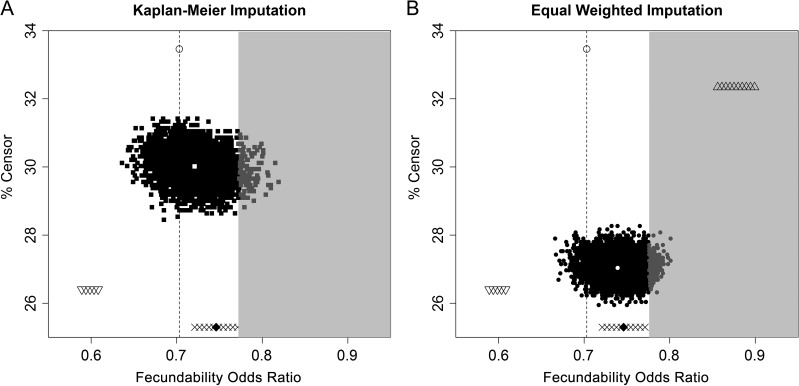
Sensitivity analysis comparing the complete-case fecundability odds ratio (FOR) (open circle with dotted line) to the FOR after multiple imputation (MI) of time to pregnancy in 128 women who withdrew using 5000 imputations for each Kaplan–Meier MI (A) and equal-weight MI (B). The triangles on the top right (B only) indicate the FOR's after 100 imputations for a scenario in which all withdrawals with high cholesterol achieved pregnancy. The upside-down triangles (A and B) on the bottom left indicate the FOR's after 100 imputations for a scenario in which all withdrawals with low cholesterol achieved pregnancy. The Xs (A and B) across the bottom indicate the FOR's after 100 imputations for a scenario in which all withdrawals achieved pregnancy and the diamond (A and B) indicates the special case in which all withdrawals achieved pregnancy 1 month after withdrawal. These outside values indicate the area within which the FOR could fall under the assumption of missing not at random. The gray-shaded area indicates a non-significant result (P > 0.05).

