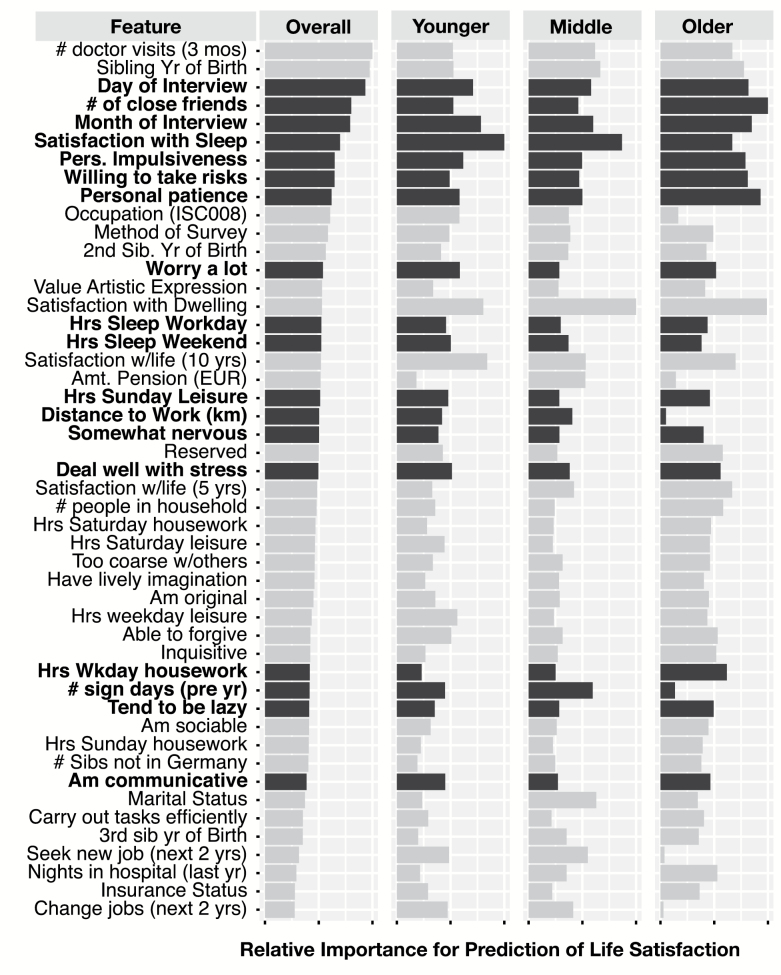
Figure 1.
Relative feature importance of top 50 measures for the prediction of life satisfaction in overall sample and three subpopulations (younger, middle-aged, and older). Importance (length of bar) is shown as a proportion of the highest importance in the subgroup. Bolded entries (darker bars) indicate selected subset of measures.

