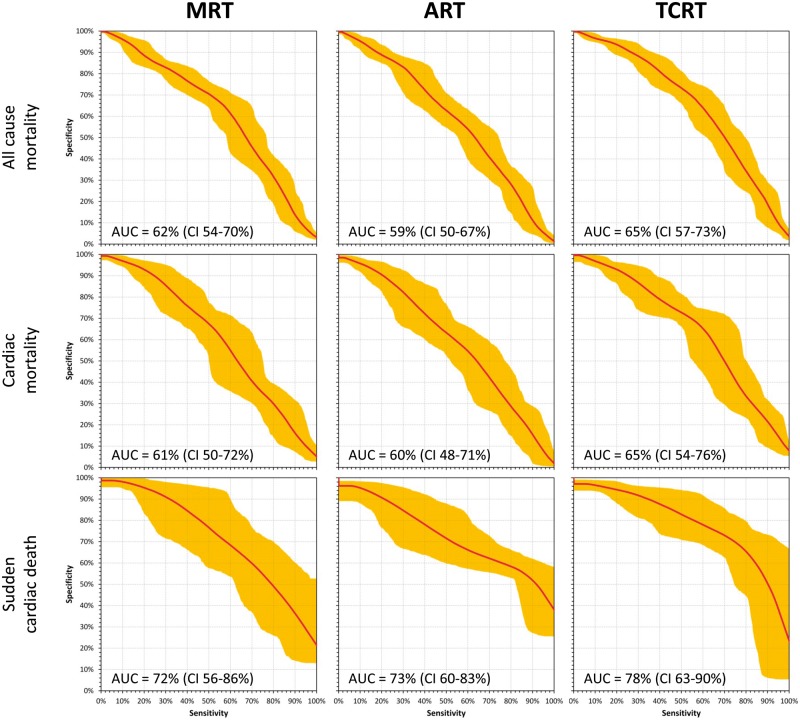
Figure 3.
Prediction of outcome in survivors of acute myocardial infarction. The figure shows receiver operator characteristics for the prediction of outcome events among survivors of acute myocardial infarction based on increased values of the spatial QRS-T angle. The graphs show the median curvatures and their 90% confidence bands obtained by bootstrap (see the text for details). The top, middle, and bottom row correspond to the prediction of all-cause mortality, cardiac death, and sudden cardiac death, respectively. The left, middle, and right column correspond to the prediction based on the maximum R to T (MRT), area R to T (ART), and total cosine R to T (TCRT) calculations, respectively. Numerical values of the areas under the characteristics (AUC) and of their 90% confidence intervals (CI) are shown in each panel (see also Table 2).

