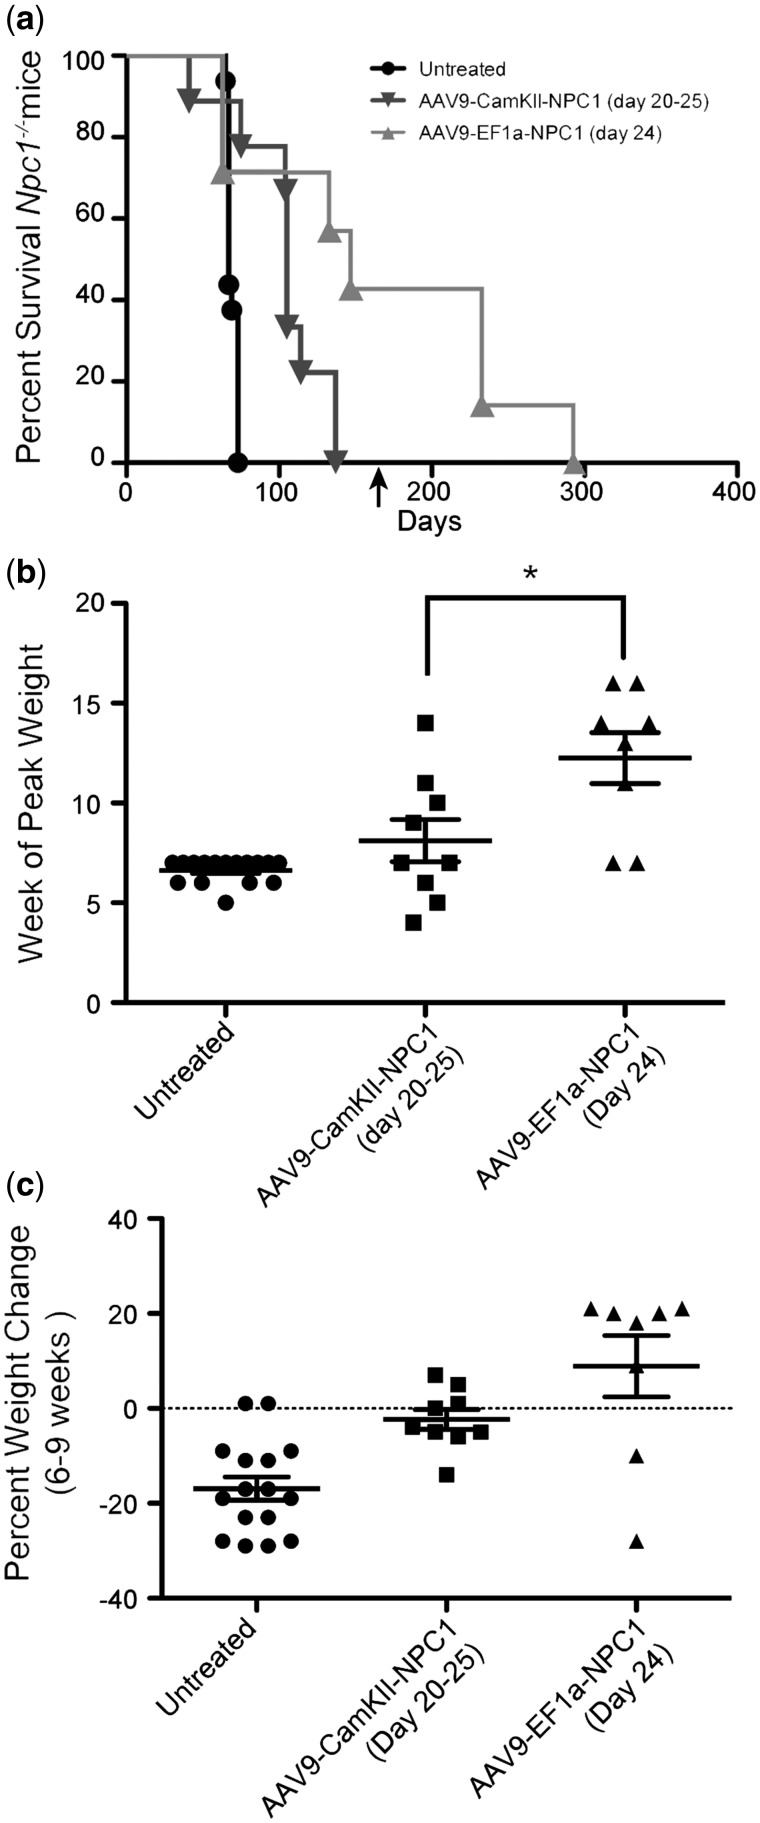
Figure 6.
AAV9-EF1a-NPC1 treatment increase survival and growth in Npc1-/- mice. (A) Kaplan-Meier curve depicts survival of: untreated Npc1-/- mice (n = 16), Npc1-/- mice (n = 9) treated with 1.3 × 10¹² GC of AAV9-CamKII-NPC1 between 20 and 25 days of life, and Npc1-/- mice (n = 7) treated with 1.2 × 10¹² GC of AAV9-EF1a-NPC1 between 20 and 25 days of life. (B) Week at which Npc1-/- mice reached peak weight. (C) Percentage weight change between weeks 6 and 9. ** P < 0.01, ***P < 0.001, Log-ranked (Mantel Cox) test or t-test two-tailed. The arrow on the X-axis indicates the date nutragel was added to the pellet diet for two of the three mice.

