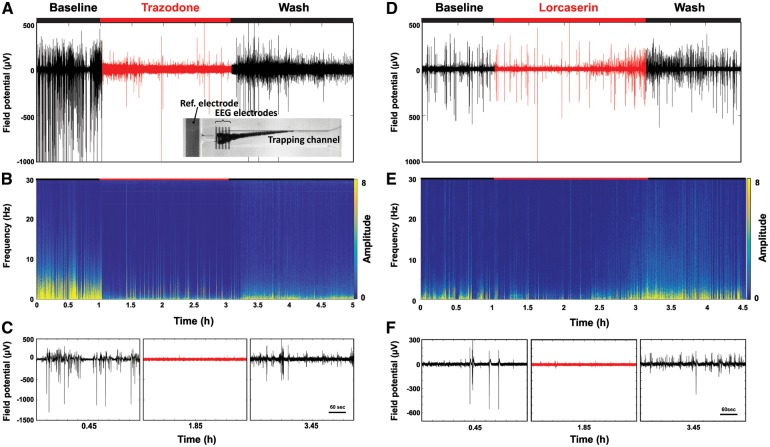
Figure 7.
iZAP EEG measurements of scn1Lab during treatment and washout with trazodone and lorcaserin. (A) Time-domain and (B) frequency-domain graphs of a representative field potential measured from one 5 dpf scn1Lab mutant treated with 250 µM trazodone. The inset photograph shows the larva positioned underneath the integrated surface electrodes of the iZAP, the reference electrode, and the trapping channel. (C) Representative zoomed field potential plots of baseline, trazodone and washing phase. The same data are shown for a representative individual scn1Lab mutant larva treated with 250 µM lorcaserin. During the 2-h treatment window there was a trend toward decreased efficacy with prolonged lorcaserin exposure (D–F).

