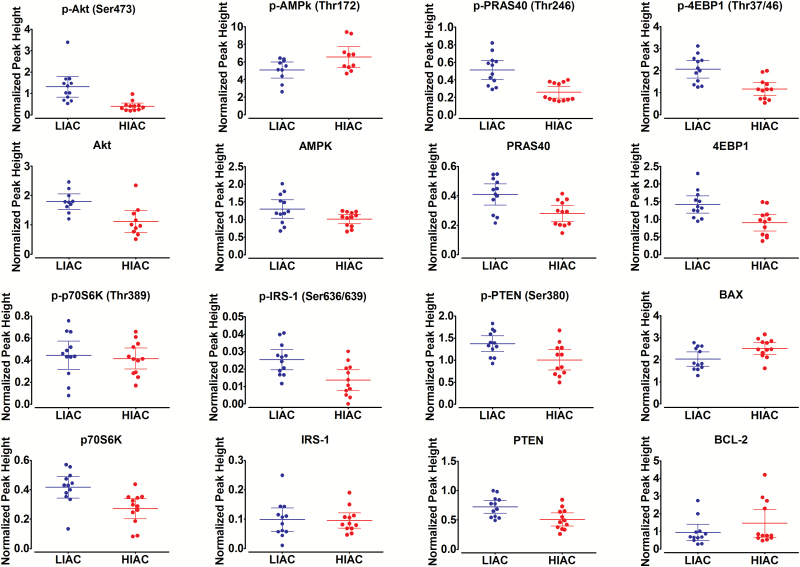
Figure 3.
Analysis of protein expression in the mammary gland. Effects of HIAC or LIAC running on patterns of protein expression in the mammary gland. Normalized peak height determined via nano-capillary immuno-electrophoresis as implemented using WES system (Protein Simple). Dot density plots showing means and 95% CIs. Table 3 contains exact P-values for difference between LIAC and HIAC.

