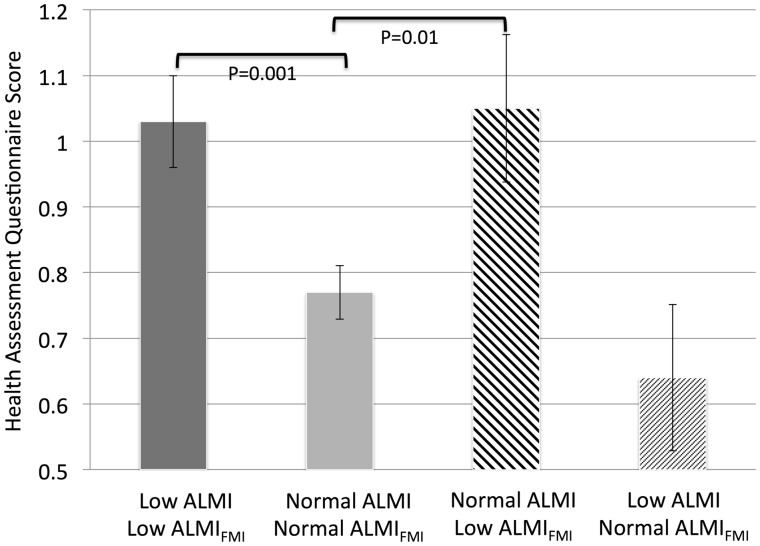
Fig. 1.
HAQ disability scores among individuals classified as low lean mass for age and normal
Those who were low by both definitions had high HAQ scores, while those who were normal by both definitions had low HAQ scores. Those who had a low appendicular lean mass index Z-score but normal adiposity-adjusted lean mass index Z-score had similar HAQ scores compared with individuals who were normal by both definitions. Those who had a normal appendicular lean mass index Z-score but a low adiposity-adjusted lean mass Z-score had HAQ scores that were similar to individuals who were low by both definitions.

