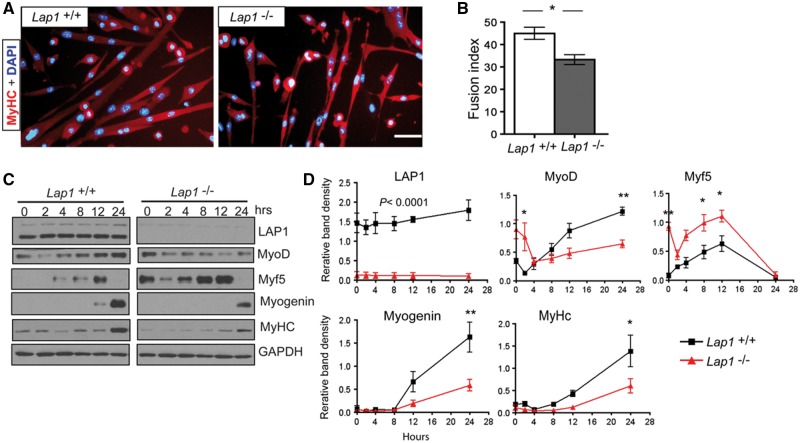
Figure 3.
Myogenic differentiation of myoblasts isolated from Lap1+/+ and Lap1-/- mice. (A) Representative immunofluorescence micrographs of myoblasts from Lap1+/+ and Lap1-/- mice after incubation for 72 h in differentiation media. Cells were fixed and stained with antibody against MyHC and nuclei labelled with DAPI. Scale bar: 50 µm. (B) Fusion index indicating percentages of myotubes containing two or more nuclei. Images were taken from 3 different cultures for each genotype and 1,061 nuclei for Lap1+/+ and 916 nuclei for Lap1-/- cells were counted. Values are means ± standard errors; *P < 0.05. (C) Immunoblots showing expression of LAP1, MyoD, Myf5, myogenin, MyHC and GADPH during differentiation of Lap1+/+ and Lap1-/- myoblasts (D) Band densities for indicated proteins normalized to the GAPDH signal at the indicated time points. Results from two independent immunoblots each from two different batches of cultures were used to measure band densities. P < 0.0001 (all time points of LAP1 signals), *P < 0.05, **P < 0.005.

