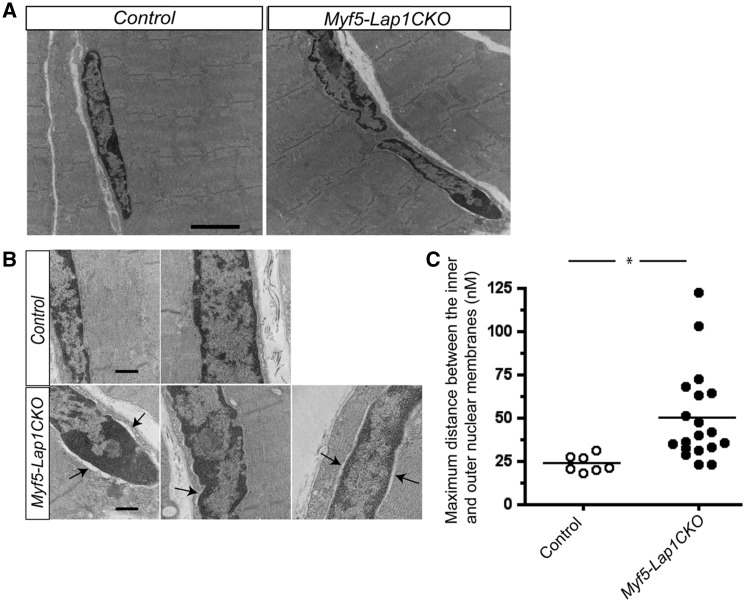
Figure 6.
Ultrastructural analysis of nuclei in quadriceps from Control and Myf5-Lap1CKO mice at P5.5. (A) Electron micrographs of quadriceps from Control and Myf5-Lap1CKO mice at P5.5. Scale bar: 2μm (B) Electron micrographs of nuclei in quadriceps sections from Control and Myf5-Lap1CKO mice. Arrows indicate areas with increased distance between the inner and outer nuclear membranes. Scale bars: 500 nm. (C) Measurement of maximum distance between the inner and outer nuclear membranes in myonuclei of Control mice (n = 7 nuclei) and Myf5-Lap1CKO mice (n = 18 nuclei). Each circle represents the value from an individual myonucleus and horizontal bars the means; *P < 0.05.

