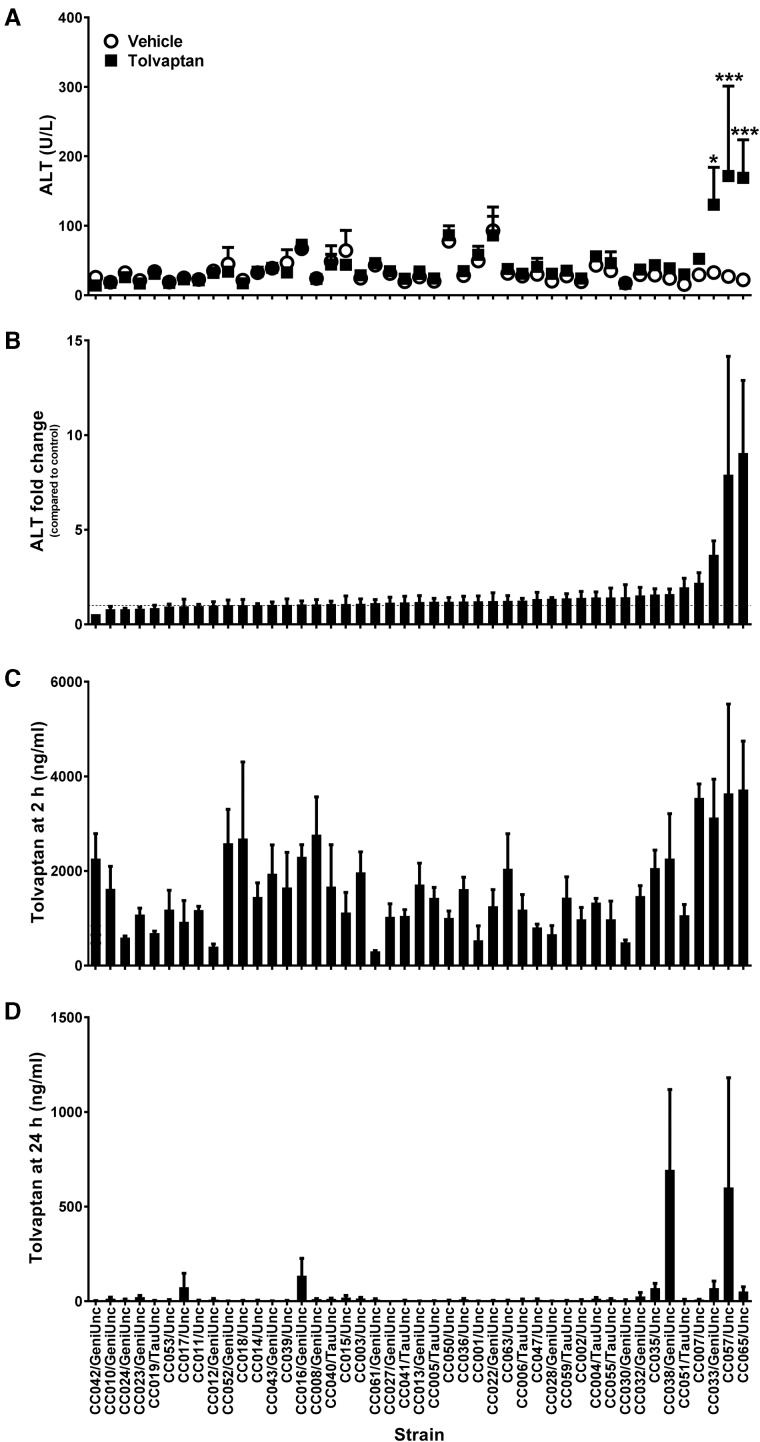
FIG. 1.
Tolvaptan induces elevations in plasma ALT in sensitive CC strains. A, Average plasma ALT for vehicle- (white circles) and tolvaptan-treated (black squares) animals. *p<.05 and ***p<.001 indicate the difference between vehicle- and tolvaptan-treated animals within each strain (Bonferroni posttest). B, Average fold change in ALT between pairs of vehicle- and tolvaptan-treated animals within each strain. C, Average plasma tolvaptan concentrations at 2 h postdose and D, 24 h postdose. Data in all panels are represented as mean + SE of N = 4 animals or pairs per strain and/or group, except as noted in the text. Strains are ordered from left to right by increasing average fold change in ALT between pairs of vehicle- and tolvaptan-treated animals within each strain.

