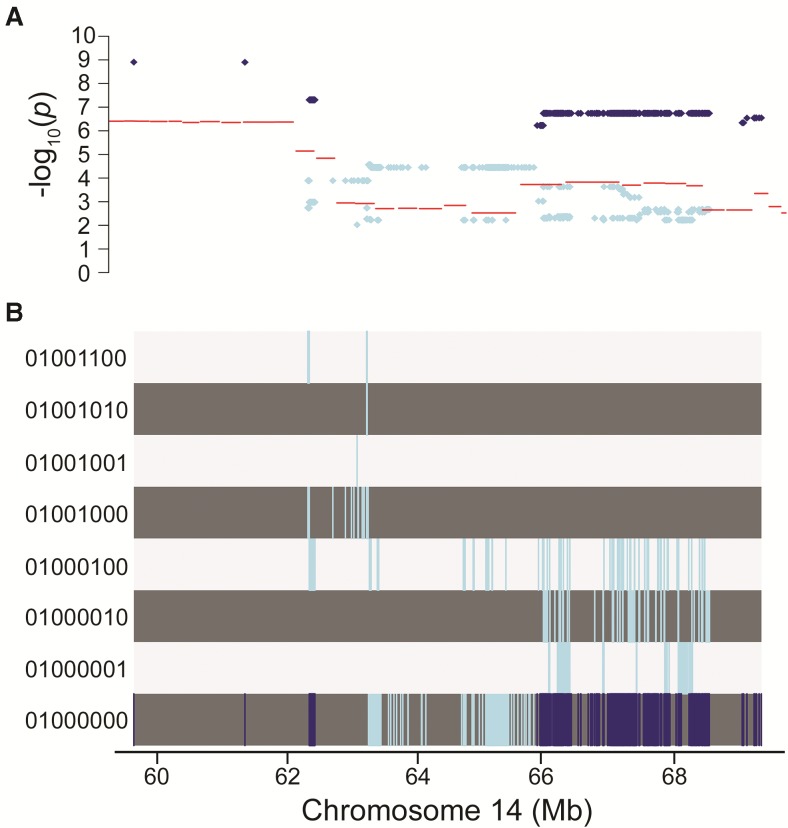
FIG. 4.
Merge analysis of chromosome 14 QTL identifies candidate causal variants. A, Comparison of −log10(p) values from 8-allele haplotype model (lines) to −log10(p) values from 2-allele merge analysis (dots) for variants in Chr14: 58.27–69.85 Mb with a −log10(p) from merge analysis >2. Dark dots indicates variants with a −log10(p) from merge analysis > −log10(p) from 8-allele haplotype model and a −log10(p) from merge analysis >5. B, Corresponding strain distribution pattern for variants represented in A. Each track corresponds to strain distribution pattern indicated in the left margin by a string of 0's and 1's representing the alleles for the 8 founder strains, in the order: A/J, C57BL/6J, 129S1Sv/ImJ, NOD/ShiLtJ, NZO/H1LtJ, CAST/EiJ, PWK/PhJ, and WSB/EiJ. Within each SDP track, the vertical lines indicate the locations of the variants within the strain distribution pattern.

