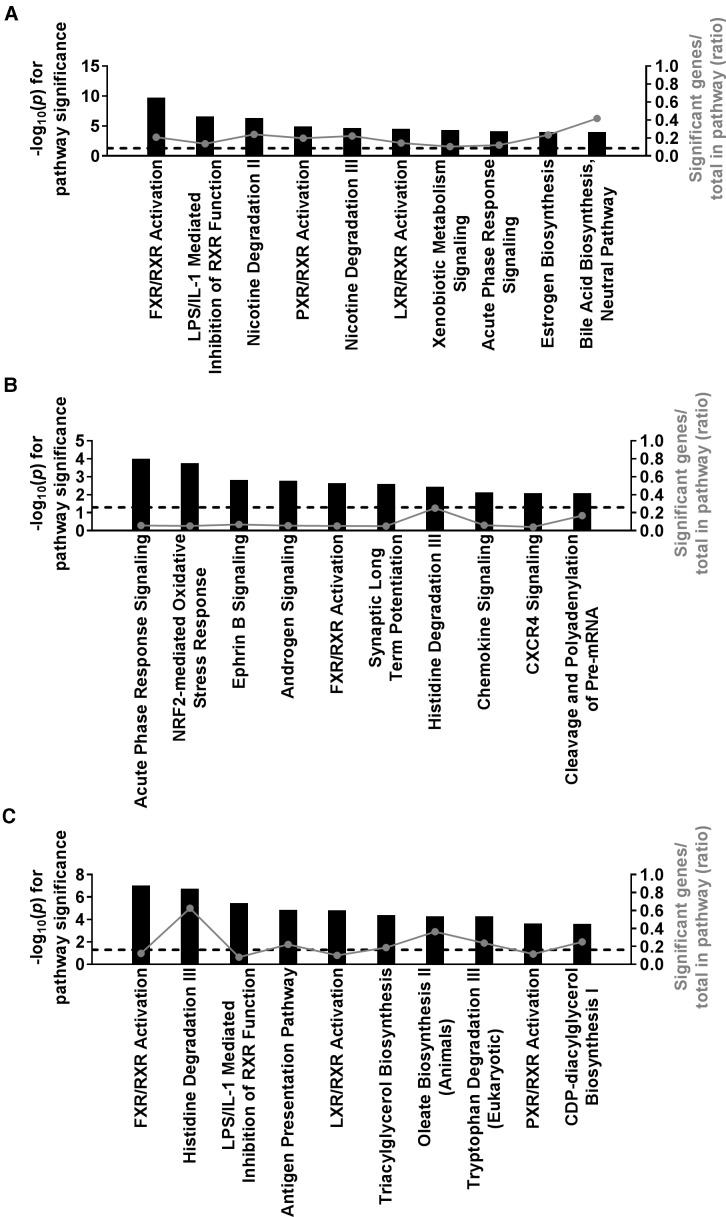
FIG. 5.
Ingenuity pathway enrichment analysis of liver gene expression identifies general mechanisms associated with the tolvaptan-induced liver response. Top 10 pathways enriched among gene expression changes associated with A, ALT fold change B, tolvaptan treatment, and C, tolvaptan response (sensitive vs resistant strains). Significant probe sets (FDR p<.2) were identified by a regression analysis in A or linear mixed model in B and C. Pathway significance is plotted by −log10(p) on the left y-axis and represented by the black bars on the graphs. The dashed line indicates a −log10(p) >1.3 threshold for significance. The ratio of significant genes relative to the total genes in the pathway is plotted on the right y-axis and represented by the gray dots (connected by a gray line) on the graphs.

