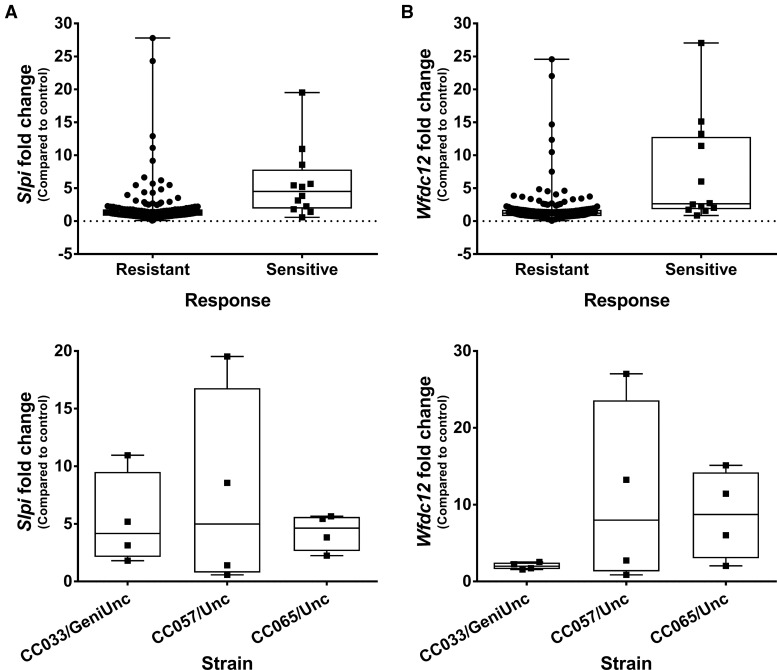
FIG. 6.
Gene expression changes in Slpi and Wfdc12 are associated with tolvaptan treatment and liver response. Average fold change for each strain pair is plotted by response on the top and strain (for the 3 sensitive strains) on the bottom for A, Slpi and B, Wfdc12. Both probe sets were significantly associated with treatment and response (FDR p<.2, FC > 2).

