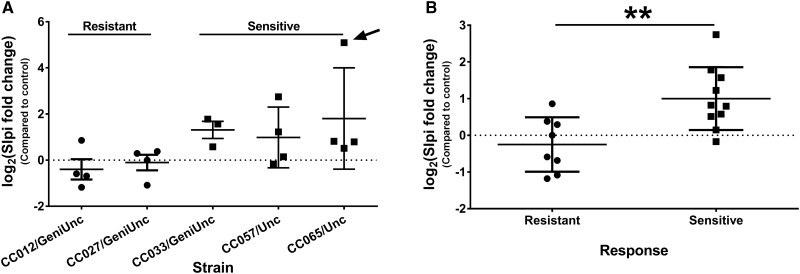
FIG. 7.
Slpi protein is elevated in plasma of sensitive strains. A, Average log2(fold change) by strain for strain pairs from 2 resistant and 3 sensitive strains. Arrow points to outlier pair in sensitive strain CC065/Unc (Grubbs’ test, α = 0.05) that was removed prior to statistical analysis in B. B, Average log2(fold change) by response (with outlier from A removed). **p<.01 indicates the difference between sensitive and resistant strains (Student’s t-test).

