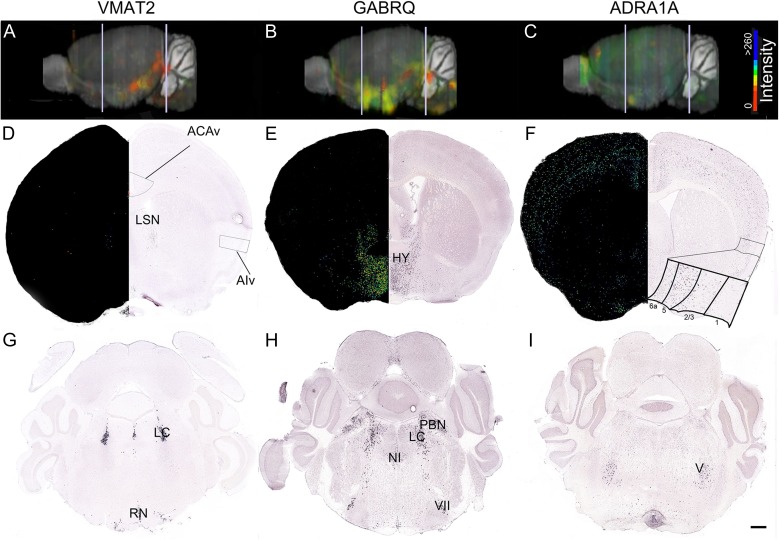
Figure 2.
Regional distribution of VMAT2, GABRQ, and ADRA1A expression in the mouse (ABA mouse database). A lateral, 3-dimensionally rendered whole-brain view of mRNA expression is shown for VMAT2 (experiment 967) (A), GABRQ (experiment 79591569) (B), and ADRA1A (experiment 75042247) (C). Bar shows ISH staining intensity. White lines in (A–C) indicate level of the higher magnification coronal section views in (D–F) and (G–I). Expression maps and raw ISH data in ACA and agranular ventral insula are shown for VMAT2 (D) GABRQ (E), and ADRA1A (F). ISH patterns in the brainstem are shown for VMAT (G), GABRQ (H), and ADRA1A (I). ACAv, anterior cingulate area, ventral; LSN, lateral septal nucleus; HY, hypothalamus; RN, raphe nucleus; NI, nucleus incertus; PBN, parabrachial nucleus; VII, facial nucleus; V, motor nucleus of the trigeminal nerve. Scale bar represents 500 μm. Image credits: Allen Institute for Brain Science.

